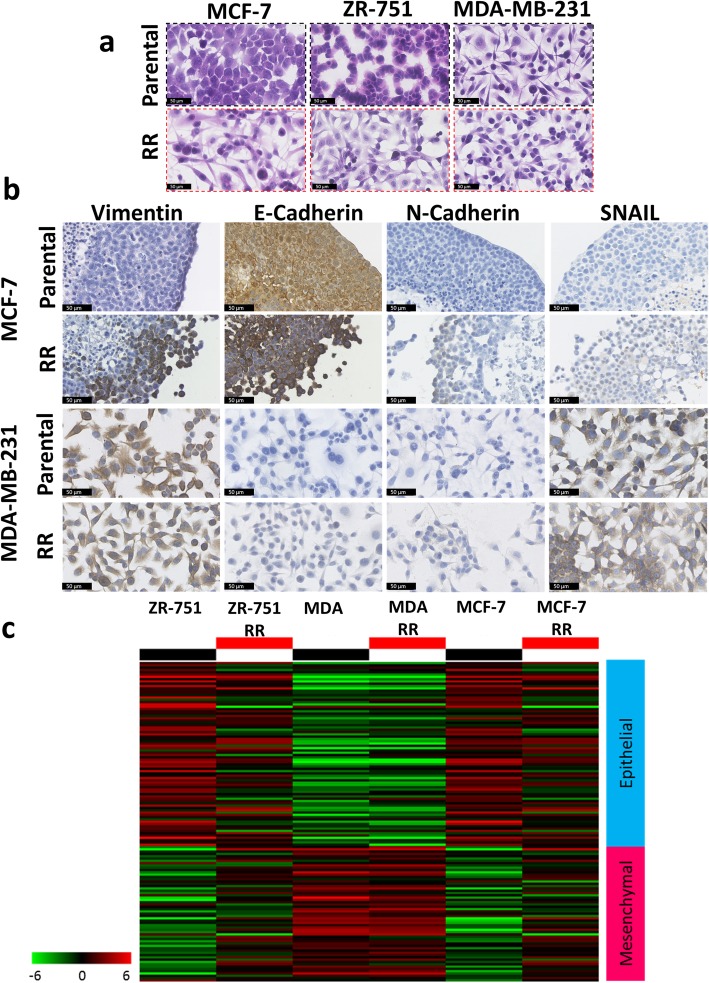
Fig. 4.
MCF-7 RR and ZR-751 RR cell lines show increased expression of vimentin, N-cadherin and SNAIL with the partial down regulation of E-cadherin. a H&E staining of parental and RR cell lines detailing their morphological differences. b IHC staining of EMT markers (vimentin, N-cadherin, SNAIL and E-cadherin) in MCF-7 and MDA-MB-231 parental and RR MTS and cells. c Heatmap showing log2 mean-centered gene expression profiles in respect of a published cancer cell EMT-signature [23]; red = higher expression, green = lower. The gene list and the order in which they appear in the heatmap are shown in Additional file 6: Table S3

