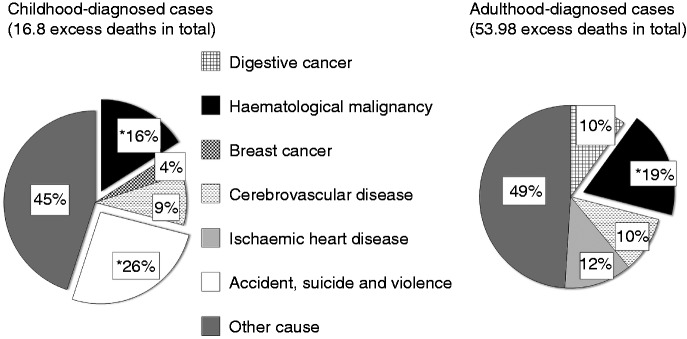
Figure 1.
Proportion of excess deaths from analysed causes.
Causes of death analysed in the cohort and the percentage of excess deaths from each of these causes, calculated as number of excess deaths from specific cause/total number of excess deaths × 100%. Definition of symbols used: *Significant number of excess deaths.

