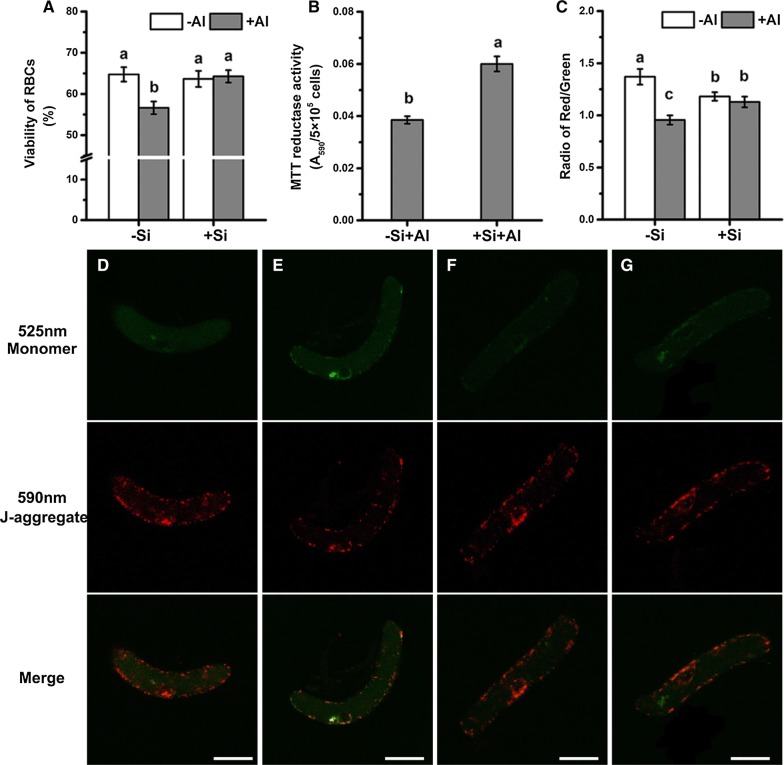
Fig. 4.
Cell viability and mitochondrial activity of RBCs. Cell viability of RBCs was measured by the trypan blue exclusion test (A). Mean ± SE (n = 10). A mitochondrial activity of RBCs was measured by the reduction of MTT after treatment with 100 μM AlCl3 (pH 4.5) for 1 h (B). Mean ± SE (n = 4). Mitochondrial membrane potential of RBCs was measured by JC-1 labelling. D Fluorescent images of JC-1 stained bare cells (−Si−Al); E Fluorescent images of JC-1 stained bare cells exposed to 100 μM AlCl3 solution for 1 h (−Si+Al); F Fluorescent images of JC-1 stained silica-coat cells (+Si−Al); G Fluorescent images of JC-1 stained silica-coat cells exposed to 100 μM AlCl3 solution for 1 h (+Si+Al). The intensity radio of red/green was calculated (C). Mean ± SE (n = 20). Scale bars = 25 μm. Different lowercase letters indicate significant differences at p < 0.05 (Duncan’s test)

