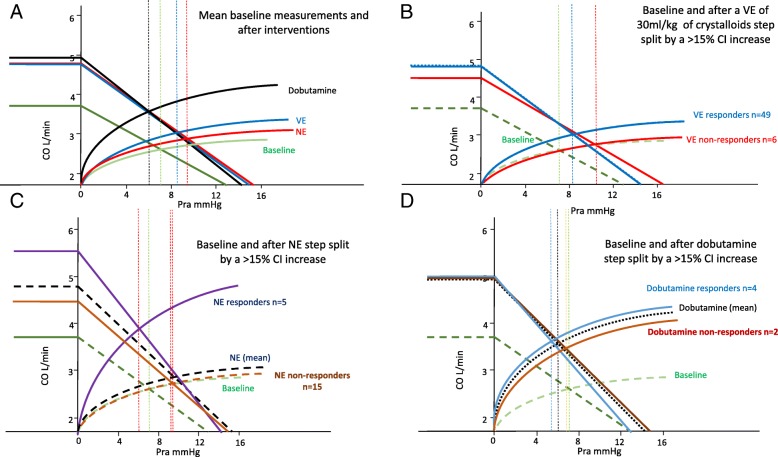
Fig. 5.
Group differences in venous return to cardiac output relations between a mean values for all patients at baseline, and following VE, under NE, if needed, and then, if needed under dobutamine. b Group differences in relations between those patients who increased their CI > 15% to a VE of 30 mL/kg of crystalloids (responders) from non-responders. c Group differences in relations between those patients who increased their CI > 15% to NE (responders) from non-responders. d Group differences in relations between those patients who increased their CI > 15% to dobutamine (responders) from non-responders. The figure uses the same format, conventions, and abbreviations as Fig. 2 bottom panel

