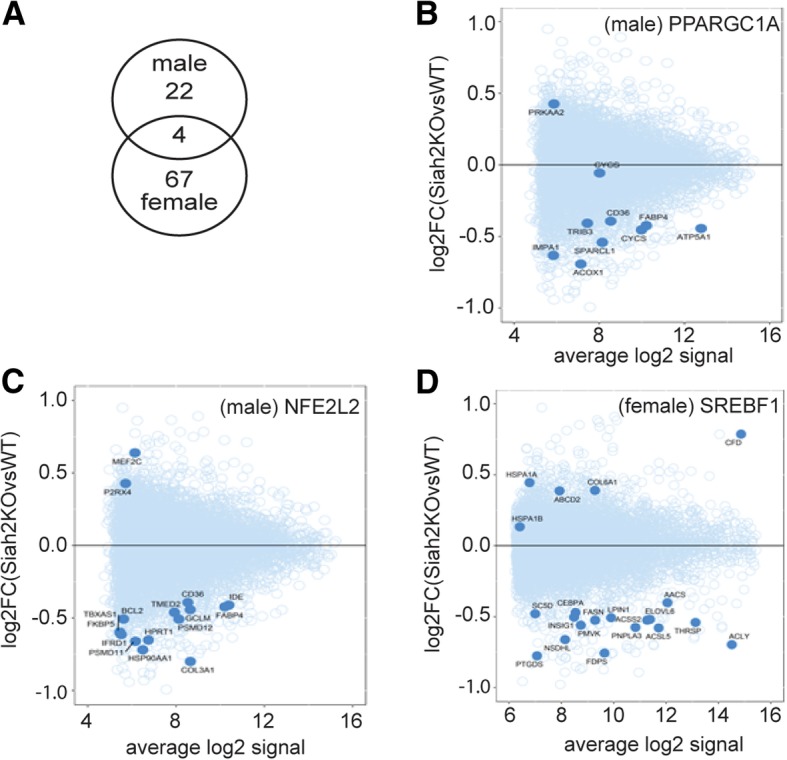
Fig. 7.

Microarray analysis of brown fat transcriptomics in HFD-fed male and female mice. a–d Analysis of gene expression in male and female BAT samples. a Overlap of differentially expressed genes (nominal P < 0.001, absolute fold-change > 1.5) in male and female samples. b–d Mean-average plots for gene targets of transcription factors Nfe2l2 and Ppargc1a (male BAT samples) and Srebf1 (female BAT samples), based on over-representation analysis in Ingenuity Pathway Analysis tool. Transcription factor target genes are shown as solid circles, whereas the remaining genes on the microarray are shown as open circles
