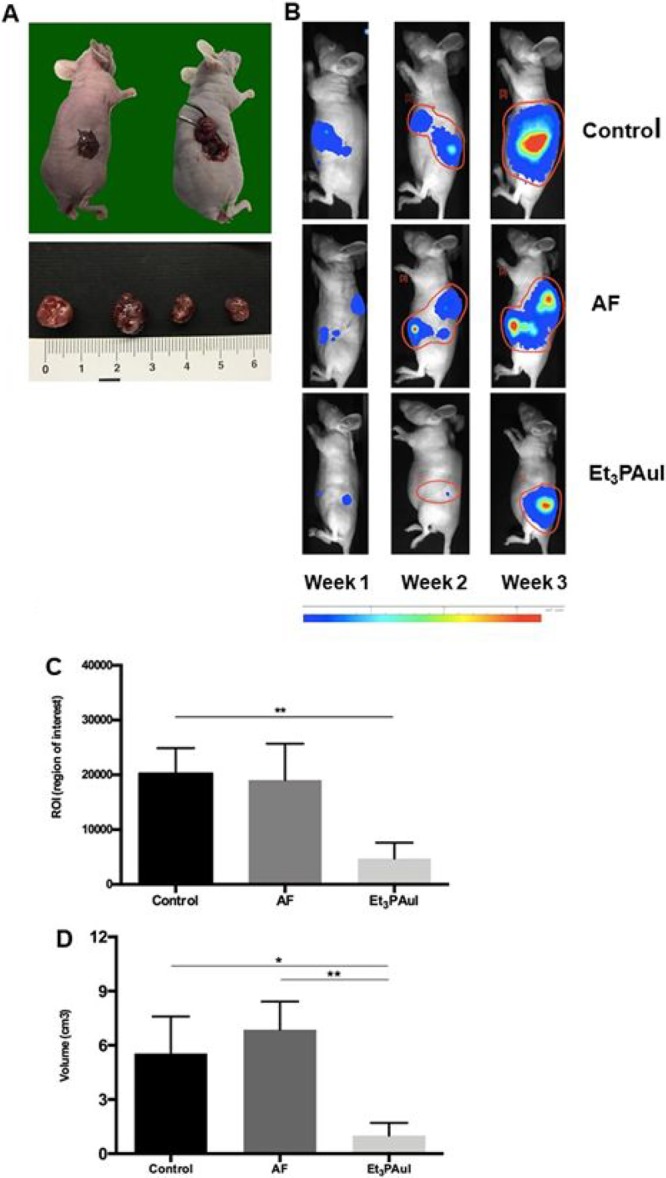
Figure 3.

(A) Orthotopic model establishment: injection of 1 × 10⁶ A2780-luc cells in the ovary bursa of nude mice. Representative macroscopic images of ovarian tumor masses obtained are showed in the bottom panels. (B) Representative pseudocolor BLI images tracking A2780-luc cells emission in mice, 7, 14, and 21 days after A2780-luc injection. Color bar represents light intensity levels reported as counts per minute (cpm). (C) Levels of ROI after 1 week of treatment; data are reported as mean of each group (n = 10 animals/group) ± SD (**p < 0.01). (D) Volume of tumor masses (mean ± SD) at the sacrifice after 3 weeks from injection of A2780-luc cells (control group, n = 8; AF, n = 5; Et3PAuI, n = 5). *p < 0.05, **p < 0.01. Further details are reported in the Supporting Information.
