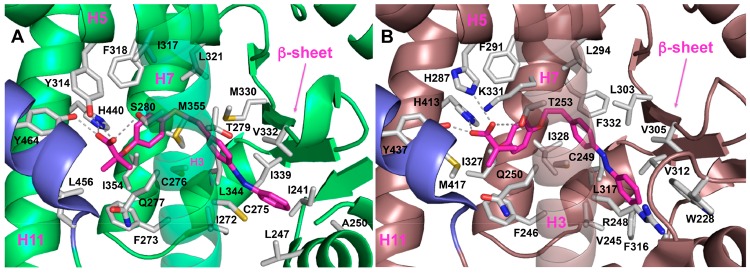
Figure 2.
Binding mode of compound 12a (magenta sticks) into the PPARα (A) and -δ (B) LBDs, represented as green and dirty violet ribbon models, respectively. Only amino acids located within 4.5 Å of the bound ligand are displayed (white sticks) and labeled. H-bonds discussed in the text are depicted as dashed gray lines. H12 is shown in slate.

