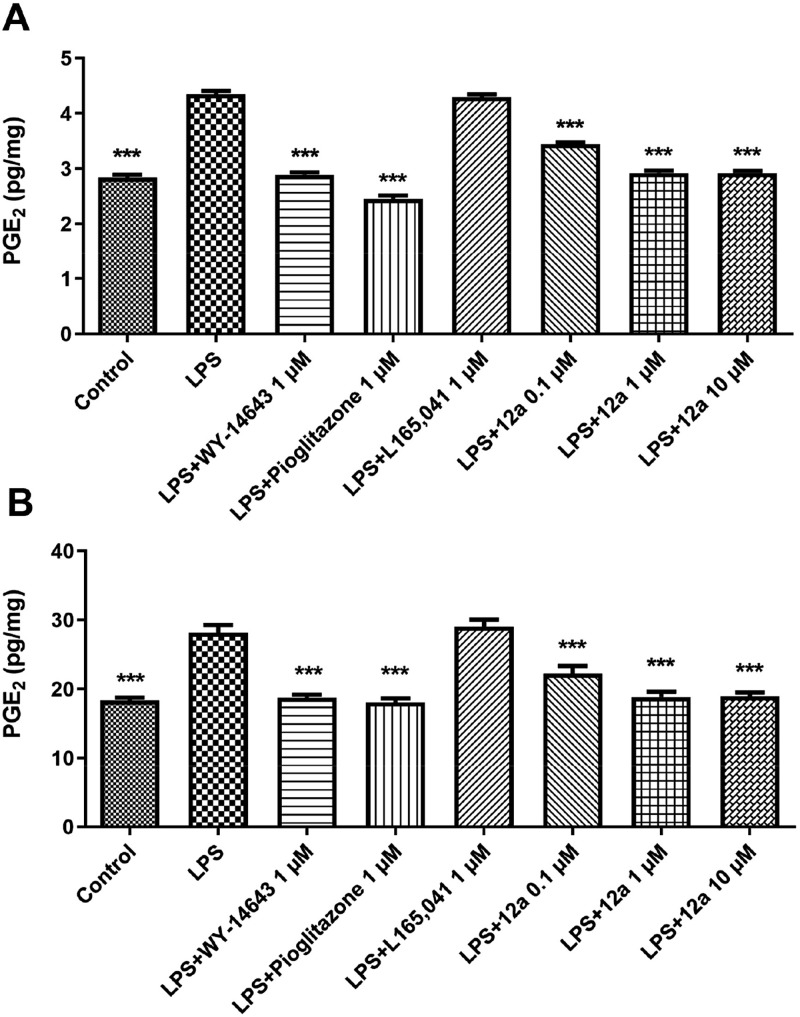
Figure 4.
Effects of 12a (0.1–10 μM) on LPS-induced production of PGE2 (pg/mg) in rat liver (A) and cortex (B), ex vivo. Data were reported as means ± SEM. Results were analyzed by analysis of variance (ANOVA) followed by Newman–Keuls posthoc test. ANOVA, p < 0.0001; posthoc ***p < 0.001 vs LPS-treated group.

