Figure 2.
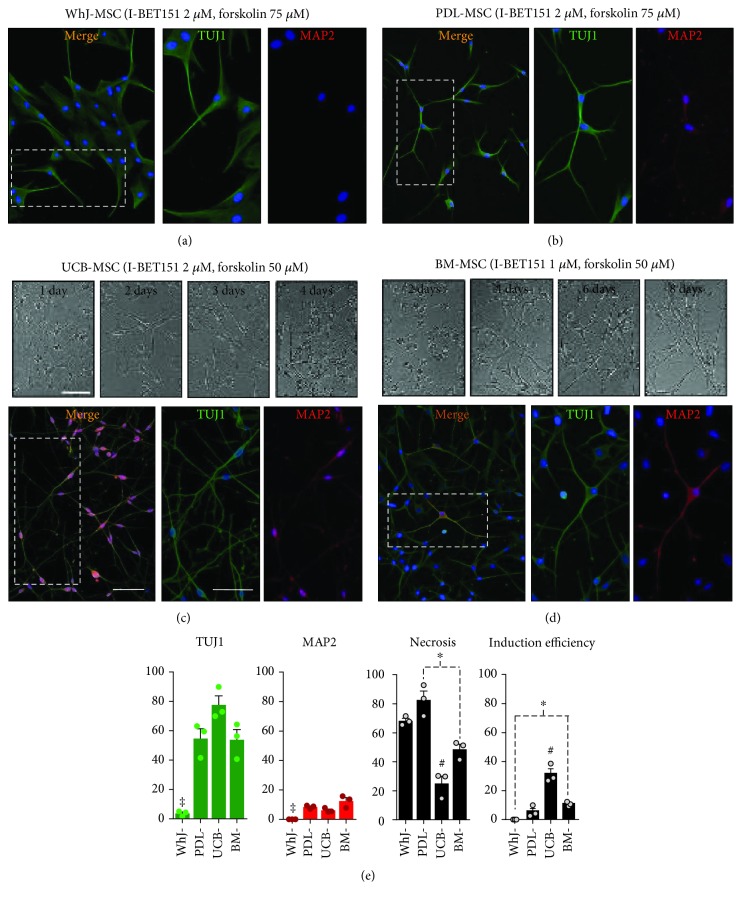
Effect of increasing I-BET151 and/or forskolin concentration on neuronal induction. Neuronal induction was conducted as in Figure 1, but the I-BET151 concentration was increased from 1 μM to 2 μM and/or forskolin concentration was increased from 50 μM to 75 μM. (a) Wharton's jelly cells did not show neuronal induction. (b) PDL-MSCs are shown as the representative source of an intermediate response (Supplementary Table 4), and (c, d) UCB and BM-MSCs show highly efficient neuronal induction. The morphological changes throughout culturing are shown in bright field pictures. UCB acquired neuron-like morphology after 2 days of induction, developing complex neuronal morphology at 4 days, while BM developed similar morphology after 8 days. Immunostaining shows that UCB- and BM-MSC developed complex TUJ1+ and MAP2+ neurite-like outgrowths. (e) Quantification of TUJ1+ cells, MAP2+ cells, and necrotic cells as in Figure 1. Induction efficiencies were calculated as the percentage of induced TUJ1+ neuronal cells versus initial cell number at day 0. The data are presented as the mean ± SEM. Significant differences were determined using ANOVA and Tukey's test. p < 0.05: ‡WhJ-MSCs or #UCB-MSCs vs. the other sources, and ∗ p < 0.05 between sources indicated with dotted lines. n = 8 from three independent biological replicates. Scale bars represent 100 μm.

