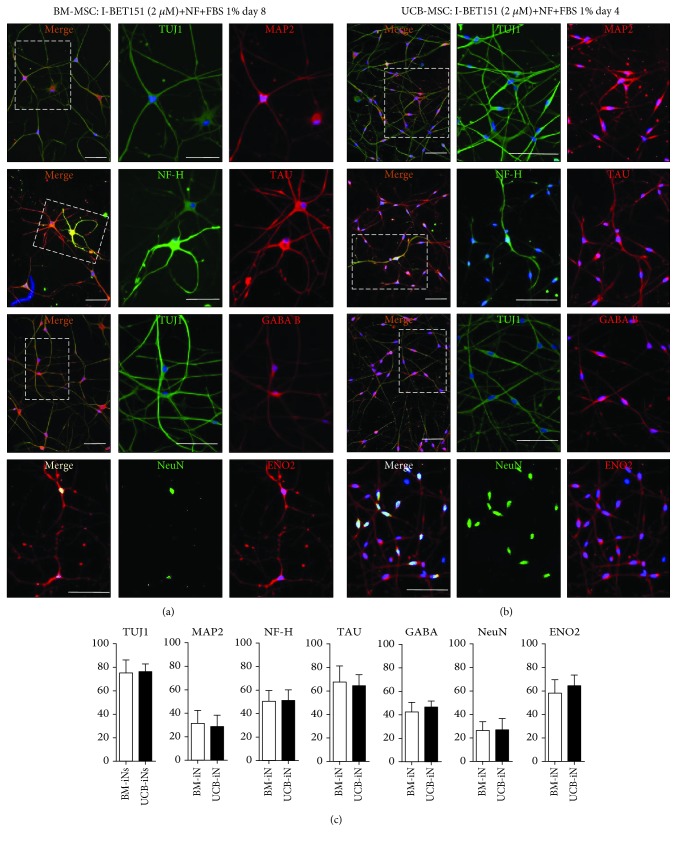
Figure 3.
Presence of mature neuronal markers after induction with ICFRYA plus neurotrophic factors and FBS in UCB- and BM-MSCs. (a, b) Representative pictures of TUJ1, MAP2, TAU, NF-H, GABA B, ENO2, and NeuN positive cells after neuronal induction. The images on A show the merge, and the images on B and C show the individual signal for each antibody. (a) BM-MSCs after 8 days of induction and (b) UCB-MSCs after 4 days of induction. (c) Quantification of cells positive for the neuronal markers induced by the ICFRYA cocktail plus neurotrophic factors. The data are presented as the mean ± SEM (∗ p < 0.05, Student's t-test) of n = 8 from three independent experiments. Scale bars represent 100 μm.

