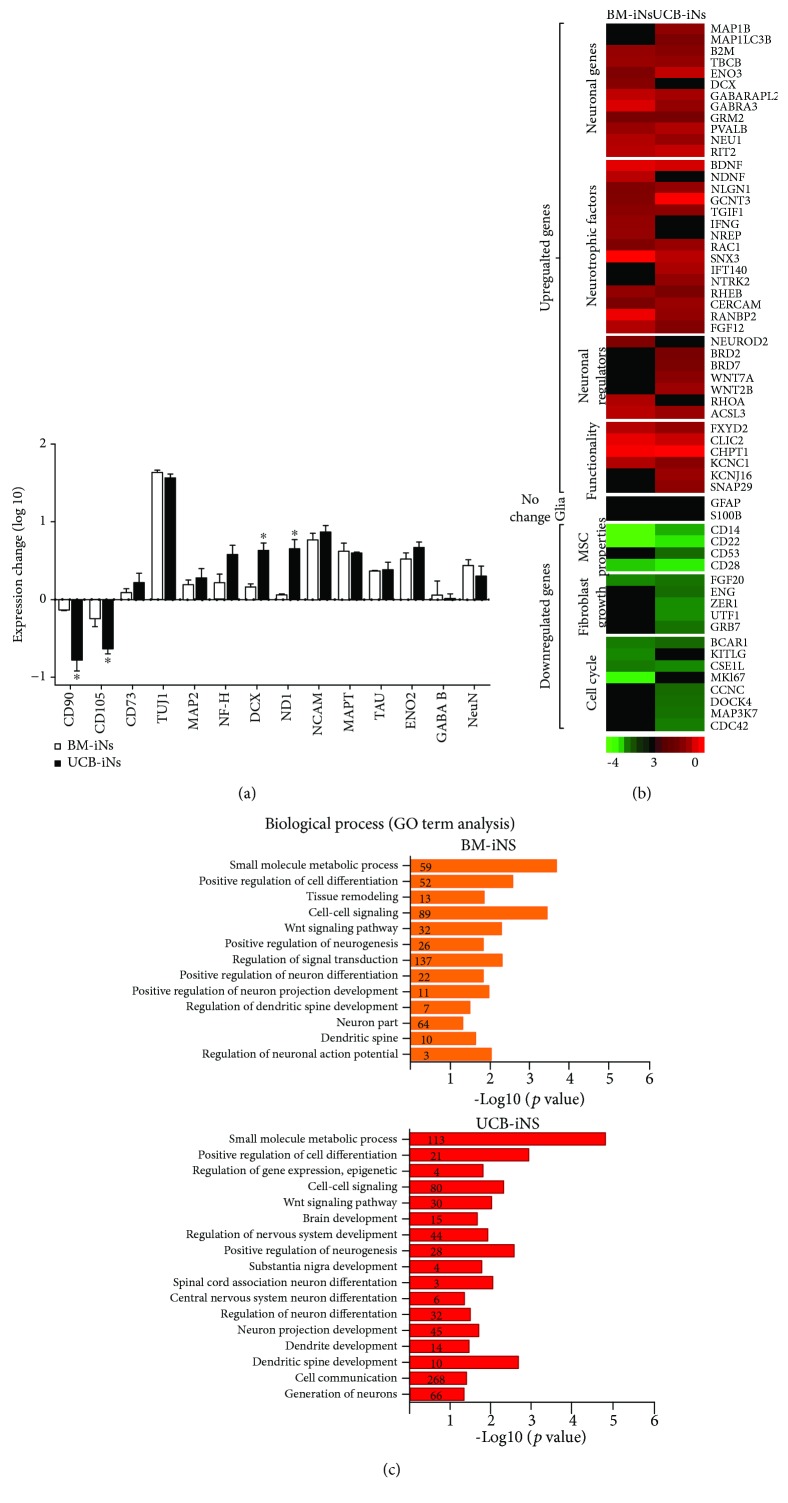
Figure 4.
Gene expression analysis in neuron cells induced from UCB-MSCs (UCB-iNs) or BM-MSCs (BM-iNs). (a) Real-time qPCR evaluation of the expression of representative mesenchymal and neuronal genes. Data are shown as fold change versus noninduced MSCs (mean ± SEM, n = 3 independent experiments) (∗ p < 0.05; Student's t-test). (b, c) Global gene expression analysis. (b) Heat map showing the change in expression of neuronal, glial, mesenchymal, and cell cycle genes from the microarray data after 8 and 4 days (BM-iNs and UCB-iNs, respectively) of induction by the ICFRYA cocktail plus neurotrophic factors. The fold change in expression was calculated by comparison with noninduced cells from the respective tissue source. Red color indicates increased gene expression while green indicates a decrease. (c) Gene Ontology (GO) analysis demonstrated that in BM-iNs and UCB-iNs, the genes with a ≥1.5-fold change in expression are implicated in the regulation of the neurogenic process. Highlighted in blue are the categories present in both BM- and UCB-INs. The number of genes implicated per category is indicated over the bars.

