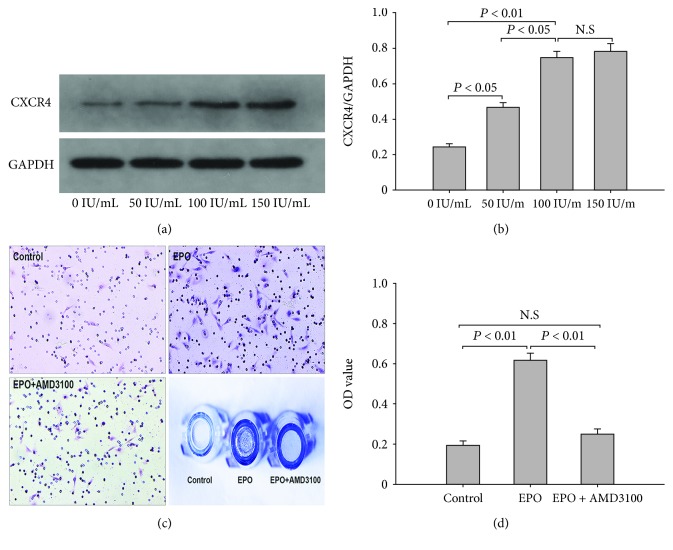
Figure 2.
Western blot and Transwell migration assay. (a) Western blot assay revealed that the expression levels of CXCR4 increased with the increment of EPO centration. (b) The CXCR4/GAPDH ratio was the lowest without EPO intervention and the highest at the maximum concentration of EPO. (c) EPO-induced migration of BMSCs was confirmed by inverted phase contrast microscopy. (d) The OD value in the EPO group was significantly higher than that of the control groups, while no significant difference was detected between the EPO+AMD3100 group and the control group. The data are plotted as mean ± SD. N.S=no significant difference.

