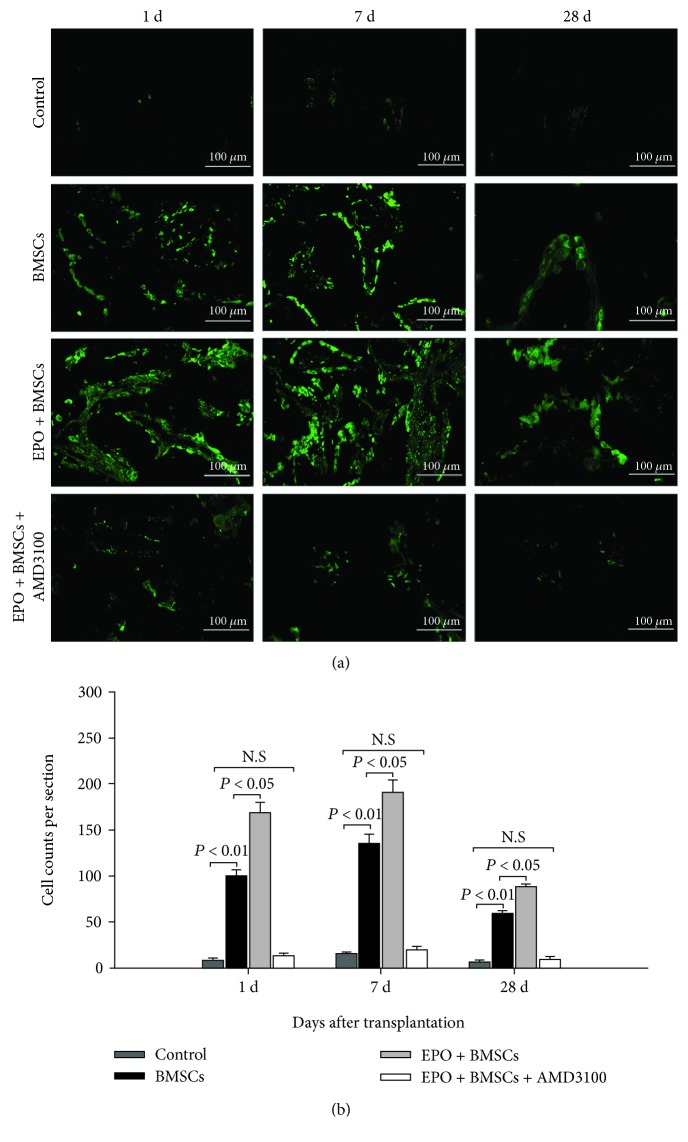
Figure 3.
Immunofluorescent microscopy. (a) Immunofluorescence staining of GFP+ cells in four groups at each time point. BMSCs: bone marrow mesenchymal stem cells. Scale bar is 100 μm. (b) Quantitative analysis of the number of GFP+ cells. The data are plotted as mean ± SD. N.S=no significant difference.

