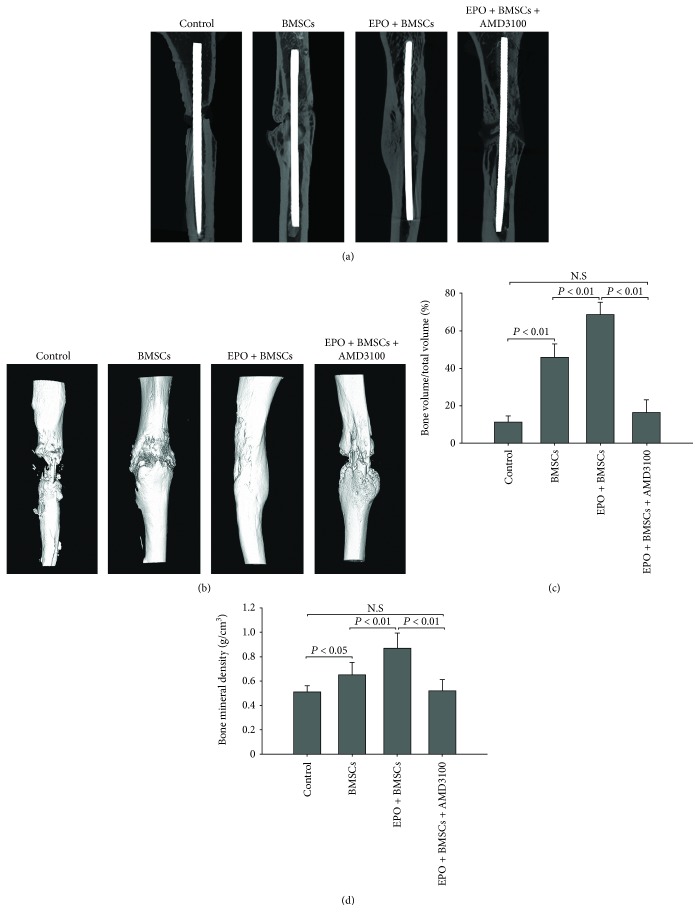
Figure 8.
Micro-CT scans were used to evaluate in vivo new bone formation. (a, b) Representative 2D cross-sectional images and 3D reconstructed images at 8 weeks of postinjury. (c, d) Quantification of newly formed bone volume and bone mineral density by micro-CT. N = 6 for each population. The data are plotted as mean ± SD. N.S = no significant difference.

