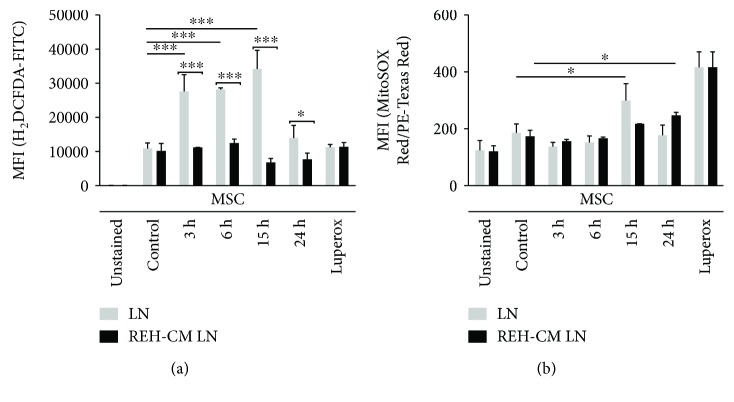
Figure 2.
ROS induction in MSC under leukemic conditions. (a) Cytosolic (H2-DCFDA) and (b) Mitochondrial (MitoSOX Red™) ROS were measured in MSC cultured in LN and REH-CM LN at the different time points indicated. MSC ROS quantification was made by flow cytometry analysis. Luperox® treatment (200 μM for 2 h) was used as a positive control of acute oxidative stress. Results represent three independent experiments done in duplicates (p values: Student t-tests; ns: nonsignificant, ∗ p < 0.05, ∗∗∗ p < 0.001).

