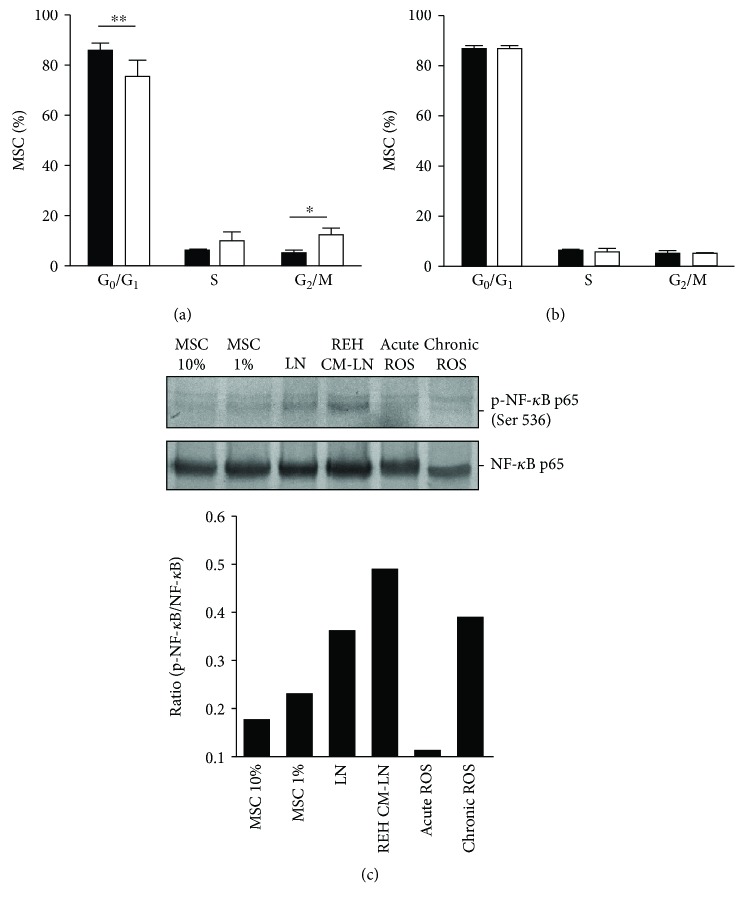
Figure 3.
Cell cycle analysis and NF-κB activation in MSC under leukemic conditions. (a) MSC were cocultured with REH cells for three days. Cell cycle evaluation was performed by propidium iodide staining and flow cytometry analysis, comparing MSC in monoculture (black bars) and MSC cultured in LN (white bars). (b) MSC were cultured with REH-CM for three days. Results are expressed as percentages of MSC in each phase of the cell cycle of three independent experiments done in duplicates (p values: Student t-tests; ns: nonsignificant, ∗ p < 0.05 and ∗∗ p < 0.01). (c) NF-κB p65 phosphorylation at Ser536 in MSC at different conditions of culture (upper panel) and quantification by densitometry in relation to NF-κB protein expression (lower panel).

