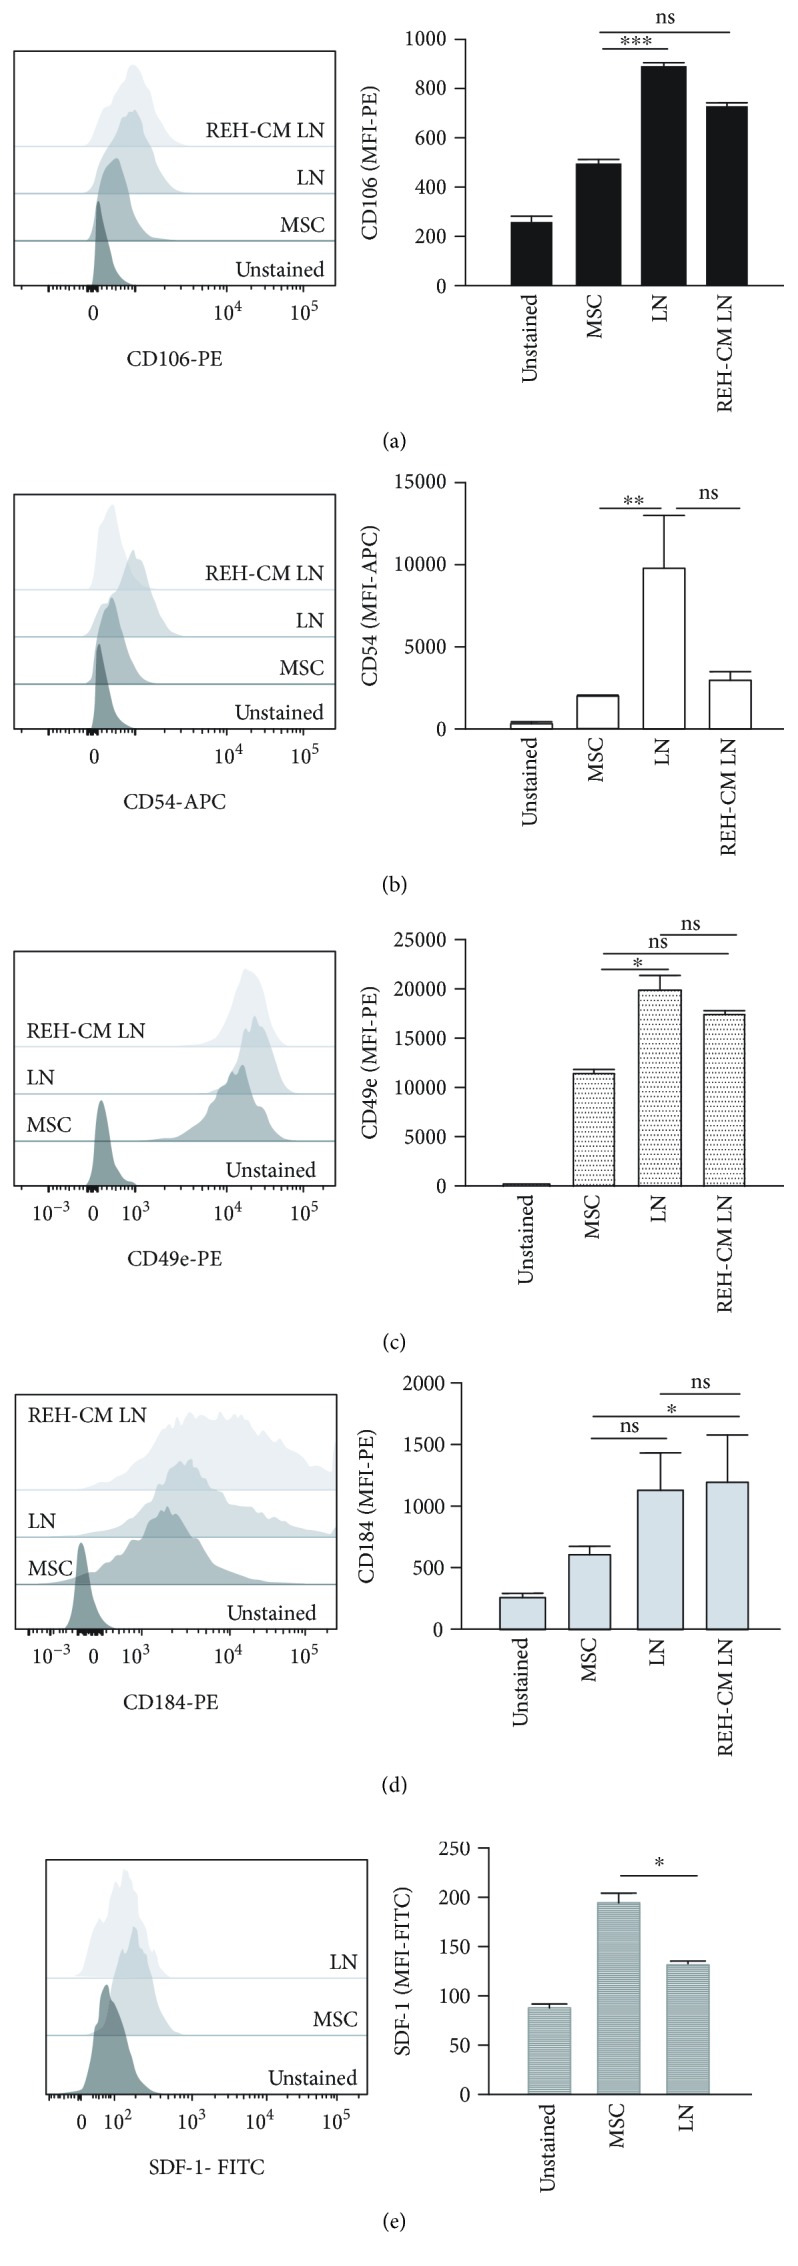
Figure 4.

Adhesion molecule expression in MSC from the LN and the REH-CM LN. MSC were cocultured with REH cells and REH-CM for three days. Flow cytometry analysis of (a) CD106, (b) CD54, (c) CD49e, (d) CD184, and (e) SDF-1 were measured as indicated. Results are expressed as the median fluorescence intensity (MFI) from two independent experiments done in triplicates (p values: Student t-tests; ns: nonsignificant, ∗ p < 0.05, ∗∗ p < 0.01, and ∗∗∗ p < 0.001).
