Figure 7.
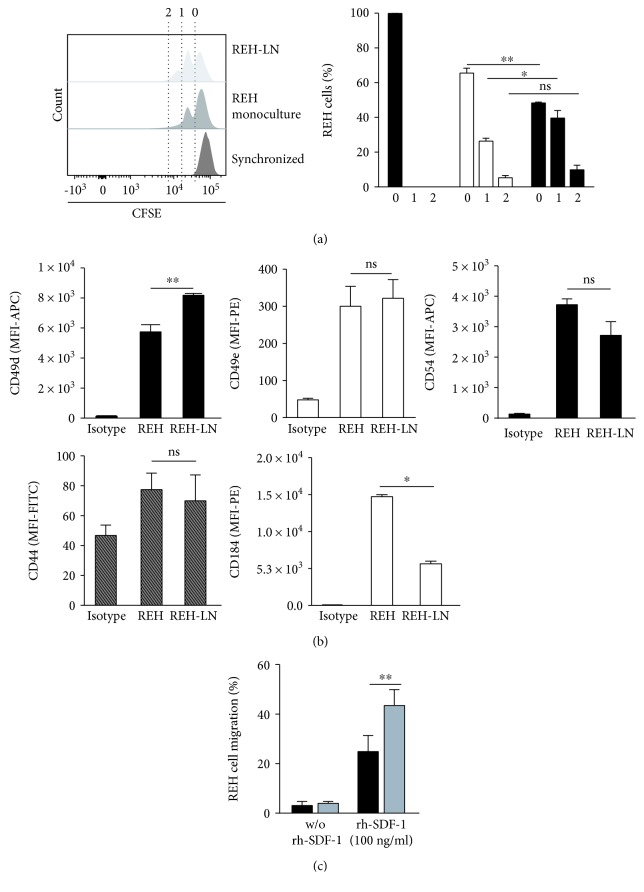
REH cell evaluation after MSC coculture. (a) REH cells were cocultured with MSC for three days after which cell proliferation was assessed. Proliferation capacity was measured by cell staining with CFSE (left panel). Cells were synchronized by serum starvation (FBS removal for two days). Percentage of synchronized REH cells (black bars), monoculture (white bars), and coculture (grey bars) at the corresponding number of cell division (0, 1, and 2) are shown (right panel). (b) Adhesion molecule expression in REH cells cultured in LN conditions for three days. Median fluorescence intensity (MFI) of CD49d, CD49e, CD54, CD44, and CD184 is shown. (c) REH cell migration capacity towards SDF-1 (100 ng/mL) was determined in a transwell insert with a 5 μm pore membrane. REH cells in monoculture and coculture with MSC were allowed to migrate for 24 h, after which cells in the lower chamber were harvested and counted by flow cytometry. The percentage of migration was calculated considering the total input of REH cells. Data were obtained from two independent experiments done in triplicates (p values: Student t-test; ns: nonsignificant, ∗ p < 0.05 and ∗∗ p < 0.01).

