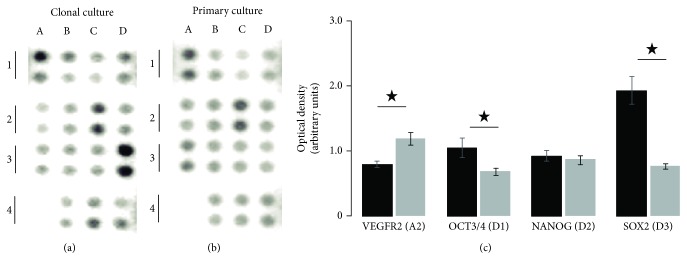
Figure 2.
Proteome profile of human multipotent stem cell markers. Neuronal precursor cells were isolated from a hOE heterogeneous primary culture by cloning. Cloned cells at passage 24 (a) and primary culture cells at passage 6 (b) were lysed, and 150 μg of total protein was added to each membrane of the antibody array. The optical density of immunopositive spots was quantified by quadruplicate. The proteins corresponding to duplicate spots of the array were as follows: Snail (A1), VEGF R2 (A2), HCG (A3), and negative control (A4); SOX17 (B1), OTX2 (B2), TP63 (B3), and Goosecoid (B4); α-Fetoprotein (C1), GATA-4 (C2), HNF-3β (C3), and PDX-1 (C4); and OCT3/4 (D1), NANOG (D2), SOX2 (D3), and E-cadherin (D4). (c) depicts data comparison for some relevant proteins. Data represent the media ± SEM. Statistical analysis was carried out with a Mann-Whitney U test. ∗p < 0.05.

