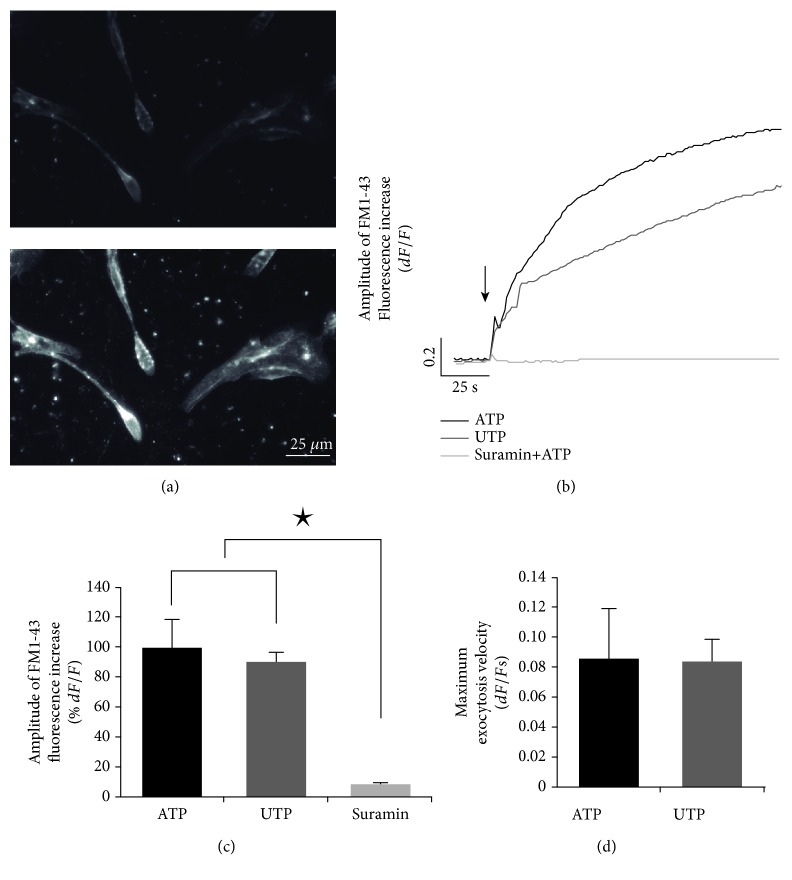
Figure 5.
Purinergic-dependent exocytosis in olfactory neuronal precursor cells. Cloned cells were cultured for 3 days, and exocytosis was evaluated using the fluorescent indicator FM1-43. (a) shows human olfactory neuronal precursor cells (hONPC) before stimulus (up) and visible fluorescence augmentation after ATP stimulation (down). (b) depicts the fluorescence mean response kinetics after applying ATP, UTP (P2Y receptor agonist), or suramin (P2 receptor antagonist) plus ATP. The arrow shows the time when stimulus was applied. (c) and (d) show bar graphs comparing responses' amplitude and velocity, respectively. Data represent the media ± SEM and were compared through a one-way ANOVA and a post hoc Tukey test (8 dishes per treatment, 5 cells/dish). ∗p < 0.05.

