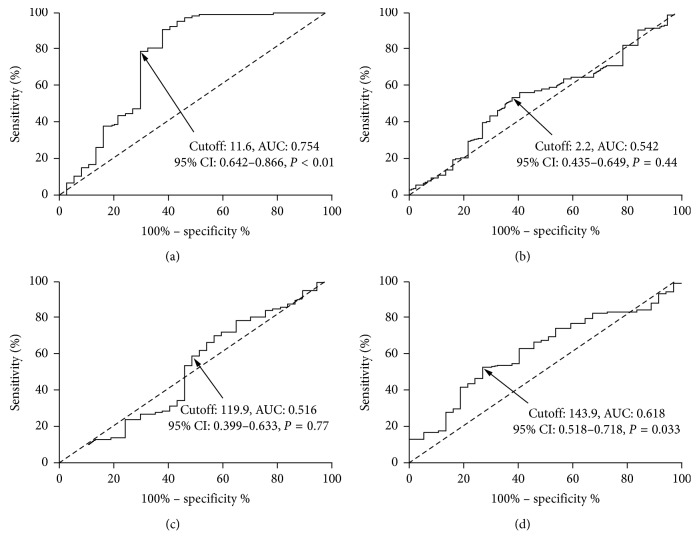
Figure 1.
ROC curve analyses of plasma endocan (a), LIS (b), CRP (c), and PaO2/FiO2 ratio (d) to predict ARDS development. Plasma endocan expression on admission was a potential predictor for ARDS development with an AUC of 0.754, a 95% CI of 0.642–0.866, a cutoff value of 11.6 ng/mL, a sensitivity of 78.7%, and a specificity of 70.3%, respectively (P < 0.01). PaO2/FiO2 ratio was also a potential predictor for ARDS development (cutoff value: 143.9, AUC: 0.618, 95% CI: 0.518–0.718, sensitivity: 53.7%, specificity: 67.6%, and P=0.033). ROC, receiver operating characteristic; AUC, area under the curve; CI, confidence interval; LIS, lung injury score; CRP, C-reactive protein; PaO2/FiO2, ratio of partial pressure of arterial oxygen to fraction of inspired oxygen.

