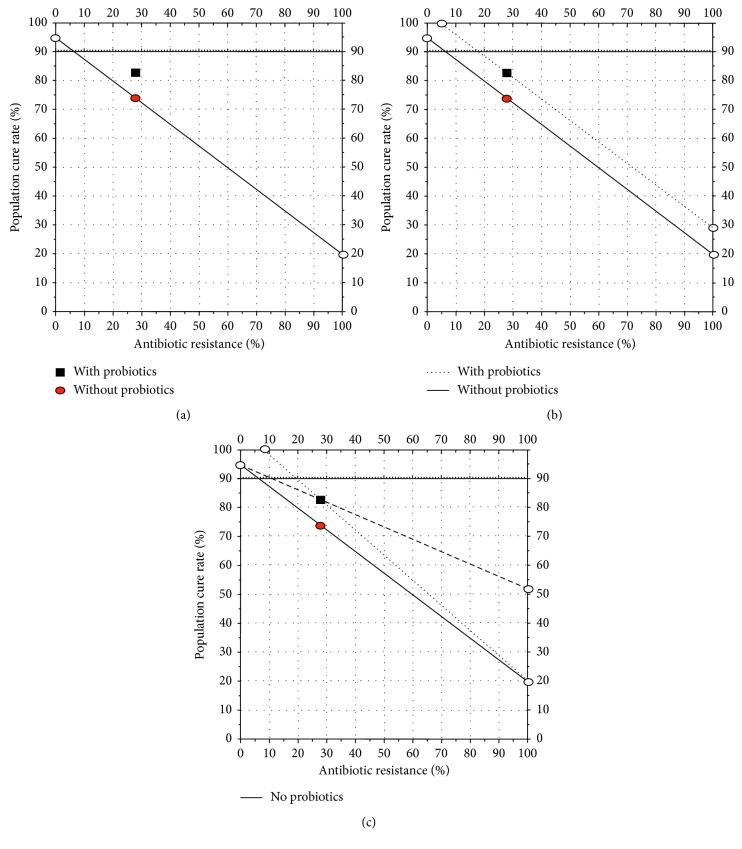
Figure 1.
(a) Hp-nomogram [9] showing theoretical cure rates with 7-day triple therapy in the absence and presence of resistance plotted based on a cure rate of 95% with susceptible infections and 20% with resistant infections consistent results in western populations. Using the data from the meta-analysis [4], the overall cure rate PP was 74.1% (circle) which would be equivalent to a proportion with resistance of approximately 28%. The results with probiotics are plotted (square) as the same resistance rate as they came from the same population. (b) Hp-treatment nomogram showing the results plotted as an additive effect (i.e., the cure rate of the overall population plus 9.1% which is the absolute delta that achieved a 12.1% increase from 74.1 to 83.5% as shown in Figure 1(a) based on [4]). The formula would be ((cure rate with susceptible infections) × (proportion with susceptible infections) + (cure rate with resistant infections) times (proportion with resistant infections)) + (absolute percent increase with probiotic). (c) Hp-treatment nomogram showing the alternate ways the outcomes could be plotted if the increase with the probiotic had been entirely dependent on the increased effect among those with susceptible infections (dotted line) or among those with resistant infections (dashed line). The experiment described above showed that the best representation is the one shown in Figure 2.

