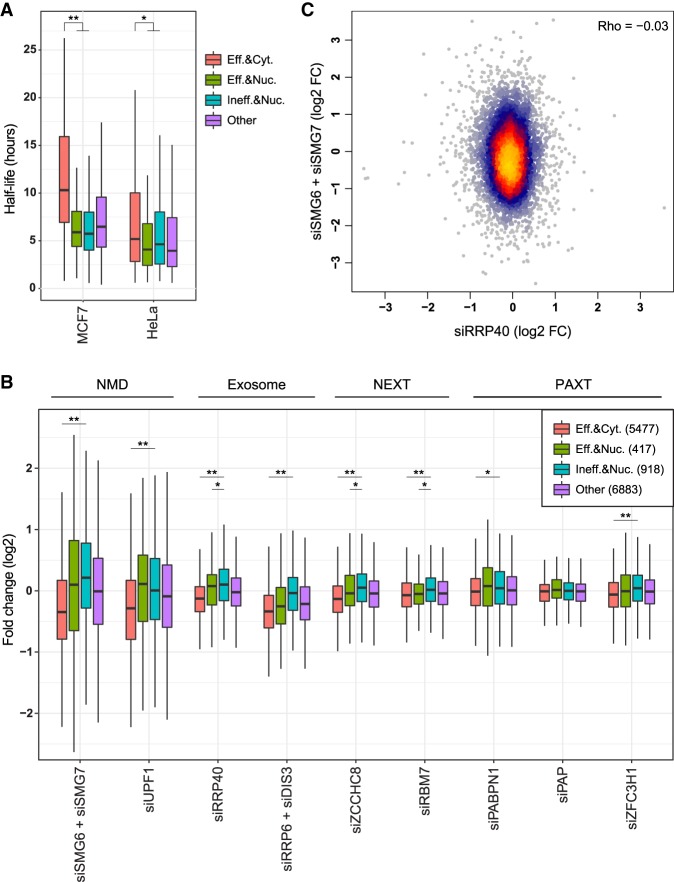
FIGURE 7.
Susceptibility to cytoplasmic and nuclear decay factors. (A) Half-lives of genes in the indicated groups: efficiently spliced (“Eff.”, worst intron splicing efficiency >0.8) and cytoplasmic (“Cyt.”, Cyto/Nuc ratio >1); efficiently spliced and nuclear (“Nuc.”, Cyto/Nuc ratio <0.5); inefficiently spliced (“Ineff.”, worst intron splicing efficiency <0.5) and nuclear; and all other. (*) P-value = 6.4 × 10⁻⁵, (**) P-value < 2 × 10⁻¹⁶ (Wilcoxon rank sum test). (B) Expression changes of genes in the indicated group following KD of the indicated factors using siRNAs in HeLa cells, each compared to the nontargeting control from the same study. (*) P-value < 0.01, (**) P-value < 10−6 (Wilcoxon rank sum test). (C) Effect of KD of SMG6 and SMG7 versus KD of RRP40 on gene expression in HeLa cells. Coloring indicates local point density.

