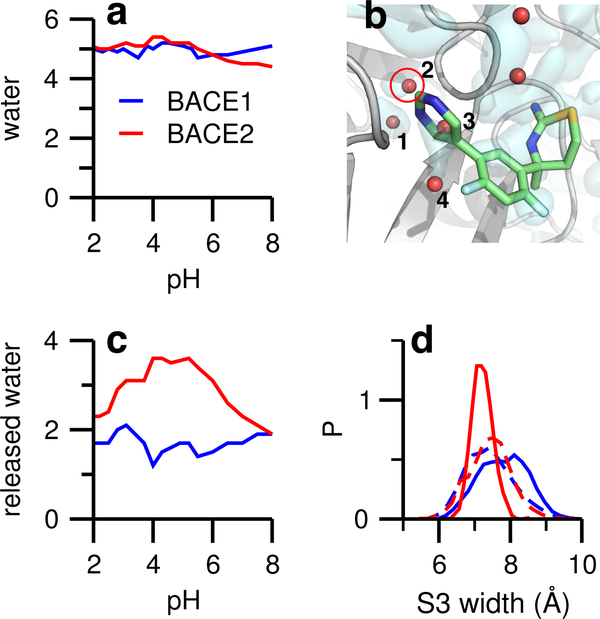
Figure 2: Water dynamics in the apo and holo forms of BACE1 and BACE2.
a) Number of water molecules in the S3 subpocket as a function of pH for apo BACE1 (blue) and BACE2 (red). The subpocket is defined by a 5-Å sphere, centered at the heavy-atom center of mass of loop residues Ser10-Gly13 and Gly230-Thr232, which flank the pyrimidinyl ring (see b). b) Zoomed-in view of the S3 subpocket with the inhibitor overlayed onto the apo BACE2 structure. Red spheres indicate crystal water molecules; those within the defined S3 subpocket are numbered. An isosurface of water density at 0.65 amu/Å3 (light cyan) was created with the VolMap plugin of VMD 25 based on the apo BACE2 simulation. c) Number of displaced water molecules in the S3 subpocket upon ligand binding to BACE1 and BACE2. d) Probability distribution of the S3 subpocket width of BACE1 and BACE2. The pocket width is defined as the distance between the heavy-atom centers of mass of the two aforementioned loop regions. Dashed lines represent the data from the apo simulations. Data from pH 4.9 were used. Distributions for other pH conditions are similar.

