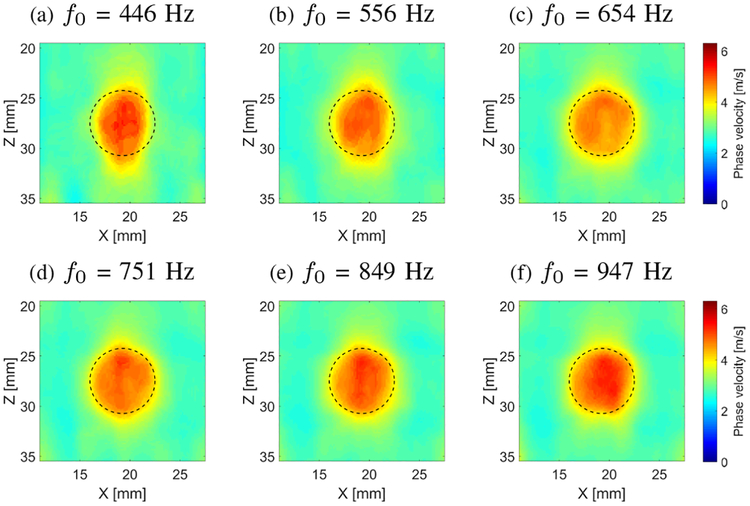
Fig. 10:
Two-dimensional shear wave phase velocity images, reconstructed for the inclusion size of 6.49 mm, calculated for a constant spatial window dimension of 4.5 × 4.5 mm and various, selected frequencies (f0) (a) 446, (b) 556, (c) 654, (d) 751, (e) 849 and (f) 947 Hz, respectively. Presented images are computed for the CIRS phantom with an inclusion Type IV. Dashed lines present a true inclusion location estimated from B-mode.

