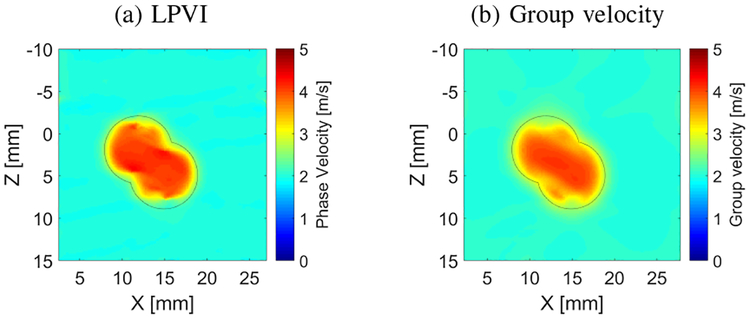
Fig. 12:
Two-dimensional shear wave (a) phase and (b) group velocity images, reconstructed for an asymmetric inclusion, calculated for a constant spatial window dimension of 4.5×4.5 mm. Fig. (a) was reconstructed for a frequency band from 900 to 1100 Hz. Presented images were computed for LISA numerical data.

