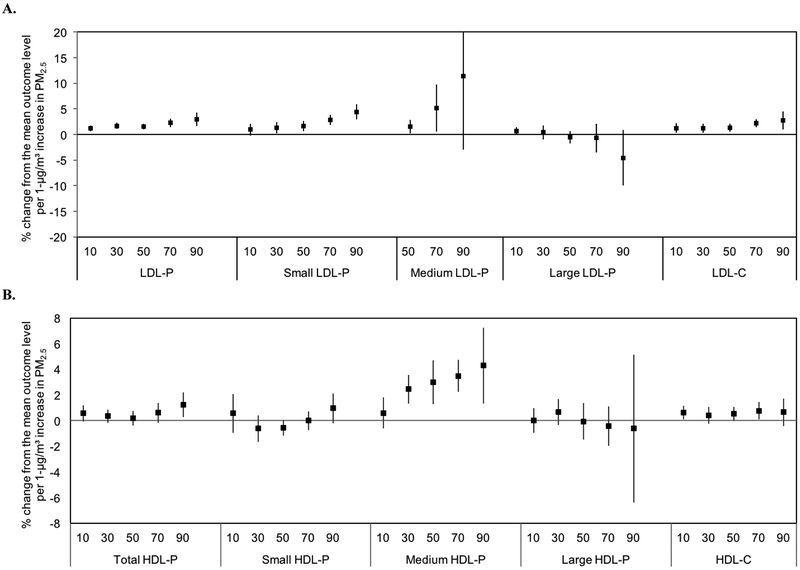
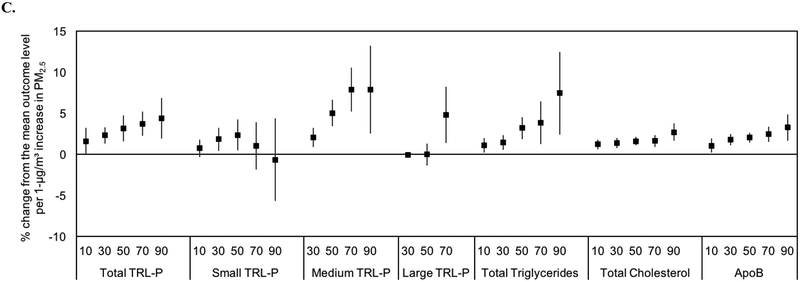
Figure 3.
Associations between 1-μg/m3 increases in annual average PM2.5 and quantiles of the distribution of lipoprotein measures. A, total particle concentrations and sizes of LDL-P and NMR-derived LDL-C. B, total particle concentrations and sizes of HDL-P and NMR-derived HDL- C. C, total particle concentrations and sizes of TRL-P and NMR-derived triglycerides, total cholesterol, and ApoB. Results are adjusted for race/ethnicity, history of smoking, sex, age, area level education, urban/rural status, body mass index, and diabetes.


