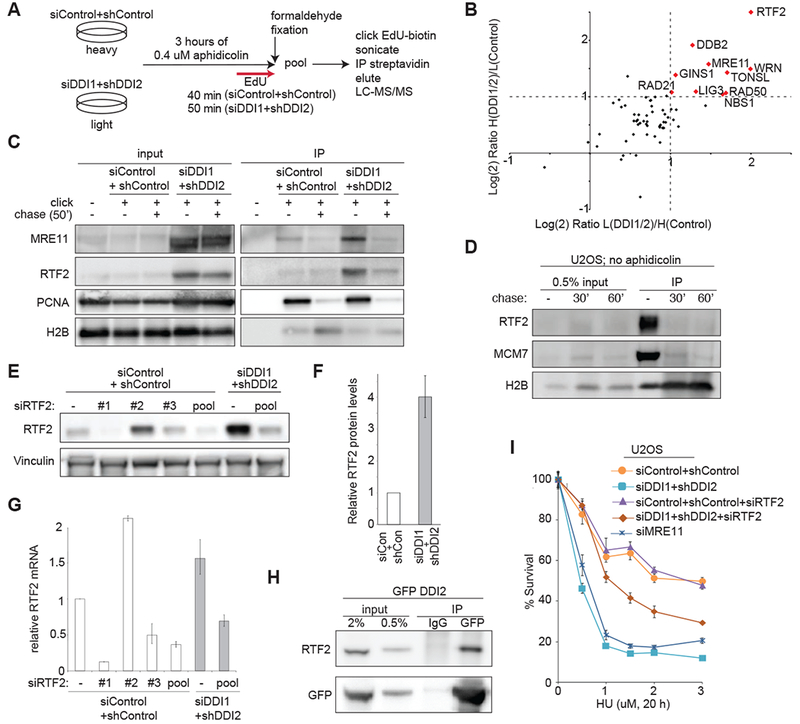
Figure 2: DDI1/2 mediate the removal of RTF2 from replication forks.

(A) Schematic of SILAC/iPOND experiment comparing replication fork occupancy during aphidicolin treatment in control vs. DDI1/2 depleted cells. The experiment was performed twice, with light/heavy label swap. (B) Graph of the Log(2) ratio of a curated list of DDI-target candidates among replication and repair proteins identified by iPOND in DDI1/2 co-depleted/control cells in two label swap experiments. Proteins reaching the enrichment threshold of Log(2)=1/−1 are named and shown in red. Proteins were quantified using the average area. (C) Validation of mass spectrometry results by iPOND and western blot. Cells were treated with 0.4 μM aphidicolin for 3 h then labeled with EdU for 50′ in the presence of aphidicolin. For chase, cells were not treated with aphidicolin and were labeled with EdU for 10′ then with thymidine for 50′. (D) Western blot showing iPOND analysis of H2B, MCM7, and RTF2 during unperturbed replication. U2OS cells were labeled with EdU for 10′ followed by 0′, 30′, or 60′ of thymidine chase. (E) Validation of RTF2 stabilization in whole cell extract. Control or DDI1/2 co-depleted cells were treated with the indicated siRNAs against RTF2 or control. Error bars represent SEM n=at least 3. (F) Quantification of relative protein levels of RTF2 in control or DDI1/2 depleted cells. (G) Quantification of relative mRNA levels of RTF2 in control, RTF2, or DDI1/2 depleted cells. (H) Coimmunoprecipitation of GFP-DDI2 and RTF2. Stably expressing GFP-DDI2 U2OS cells treated with 2 μM MG132 were subject to immunoprecipitation by anti-GFP or an IgG control, using an IP buffer containing 5 mg/ml NEM, and immunoblotted for RTF2. (I) Graph showing survival of U2OS cells treated with the indicated doses of HU. Cells were depleted of MRE11, control, or DDI1/2 with and without knockdown of RTF2. Error bars represent SEM n=3. See also Figure S2
