
Figure 3: Stabilization of RTF2 by DDI1/2 depletion causes impaired recovery from replication stress.
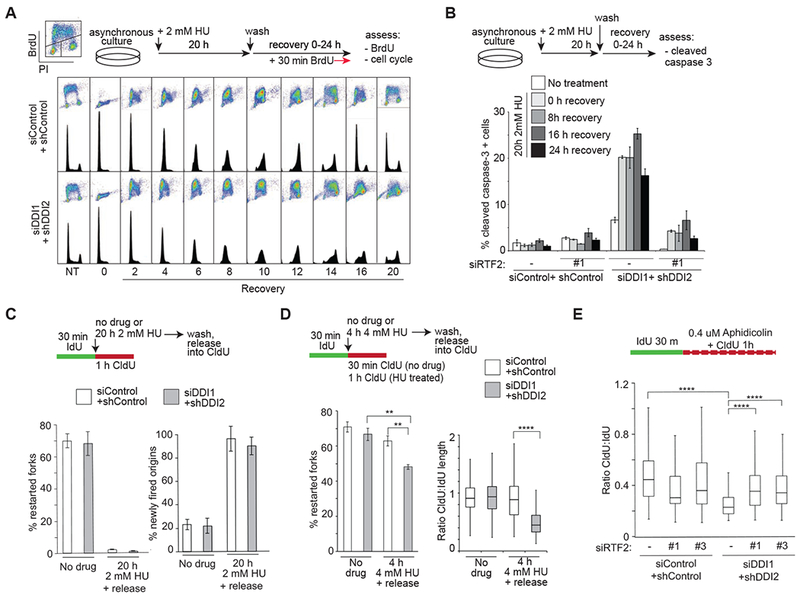
(A) Analysis of cell cycle progression in control and DDI1/2 depleted cells following synchronization by 20h 2mM HU treatment and release. 30 min prior to indicated timepoints, cells were labeled with BrdU. Images are representative of at least 3 independent experiments. (B) Analysis of the percentage of apoptotic cells as determined by cleaved caspase-3 staining measured by FACS. U2OS control and DDI1/2 depleted cells with or without knockdown of RTF2 were synchronization by 20 h 2 mM HU treatment and released for indicated times. Error bars represent SEM n=3. (C) Quantification of the percentage of restarted forks [restarted forks/(restarted forks plus non-restarted forks)] and newly-fired origins [newly fired origins/(continuing forks plus newly fired origins)] following 20 h of 2 mM HU in control and DDI1/2 knockdown cells. (D) Quantification of the percentage of restarted forks [restarted forks/(restarted forks plus non-restarted forks)] following 4h of 4 mM HU and of fork restart productivity defined by the ratio of CldU length to IdU length of restarted forks following 4h of 4 mM HU in control and DDI1/2 knockdown cells. (E) Analysis of fork processivity defined by the ratio of CldU to IdU label length of continuing forks treated with 0.4 uM aphidicolin during CldU labeling in control and DDI1/2 depleted cells with or without knockdown of RTF2. Each panel includes a schematic for experimental setup. Error bars represent SEM n=3. *p<0.05 **p<0.01 ***p<0.001 ****p<0.0001 by ANOVA. See also Figure S3