Figure 7.
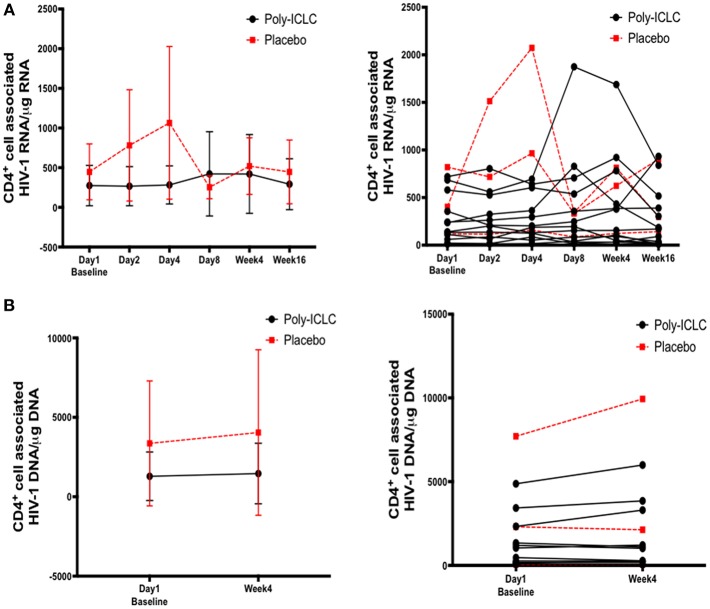
Longitudinal assessment of cell associated HIV-1 RNA and DNA values show no significant changes overall following discrete dosing of Poly-ICLC. (A) Following RNA extraction from purified CD4+ T cells at baseline and multiple time points following Poly-ICLC, rtPCR for HIV-1 RNA was performed in quadruplicate. Cell-associated HIV-1 RNA copy number is expressed as copy number per 1 μg of RNA in purified CD4+ T cells. The left graph depicts pooled values from all participants in Arm A (Poly-ICLC) and Arm B (placebo), with the mean values and standard deviation. The right graph depicts this data as individual values over time for each participant in Arm A and Arm B. (B) Following DNA extraction from purified CD4+ T cells at baseline and at week 4, rtPCR for HIV-1 DNA was performed in quadruplicate. Cell-associated HIV-1 DNA copy number is expressed as copy number per 1 μg of DNA in purified CD4+ T cells. Left graph depicts pooled values from all participants in Arm A and Arm B. The right graph shows individual values for each participant in Arm A and Arm B. Values for subjects in Arm A (Poly-ICLC) and Arm B (Placebo) are depicted by solid and dashed lines, respectively.

