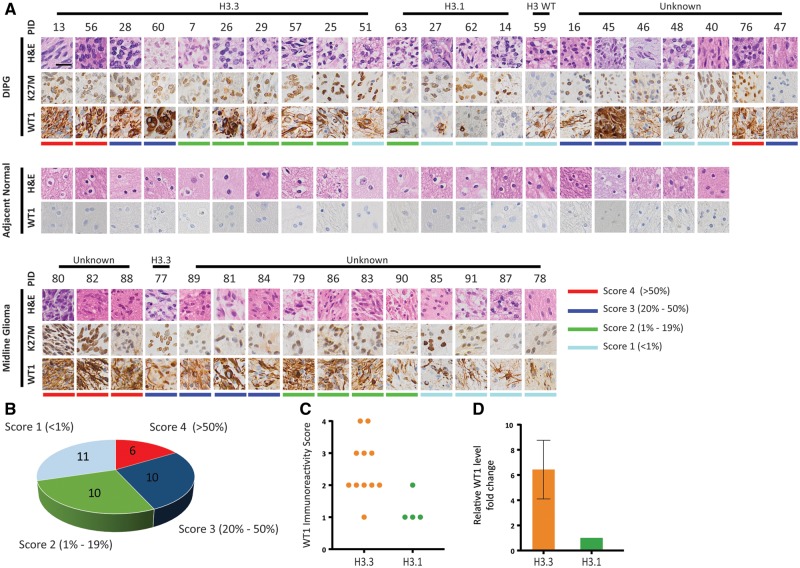
FIGURE 3.
Immunohistochemistry of a large cohort of DIPGs indicated high expression of WT1 in H3.3 subtype compared with H3.1 subtype DIPGs. (A) IHC of a large cohort of DIPGs and pediatric midline gliomas showed WT1 overexpression in tumor compared with adjacent healthy brain tissue was valid. Scale bar = 50 µm. (B) Each tumor specimen was reviewed by a blinded neuropathologist and given an immunoreactivity score based on the number of WT1-positive cells. The pie chart shows the WT1 scores distribution of the specimens. (C) Examination of WT1 immunoreactivity scores revealed that WT1 scores of the specimens are associated with histone H3 mutation status. The distribution of WT1 immunoreactivity score was significantly different between H3.3 and H3.1 subtypes (Fisher exact test, p = 0.017). (D) qRT-PCR using cDNA from H3.3K27M DIPG tumor tissue (n = 3) and H3.1K27M DIPG tumor tissue (n = 2) showed higher expression of WT1 in H3.3K27M tumor specimens compared with H3.1K27M tumor specimens (6.4-fold).

