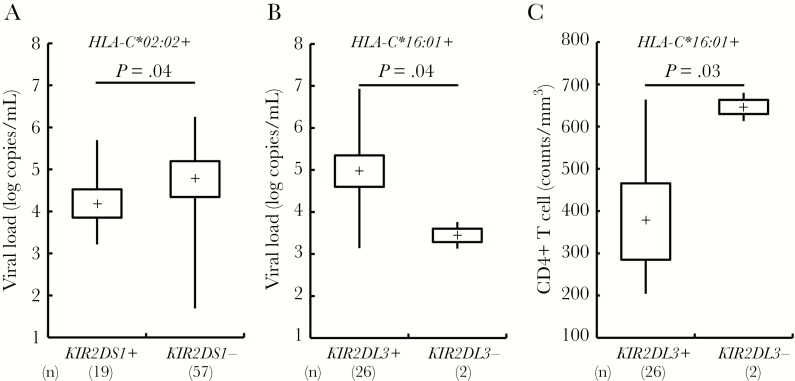
Figure 2.
A–C, Viral load and CD4+ T-cell count differences between killer immunoglobulin-like receptor (KIR) positives versus negatives under the existence of their ligand human leukocyte antigen (HLA) alleles. P values by Mann–Whitney U test are shown. The boxplot indicates minimum and maximum (line), 25th centile and 75th centile range (box), and median (dot in a box).

