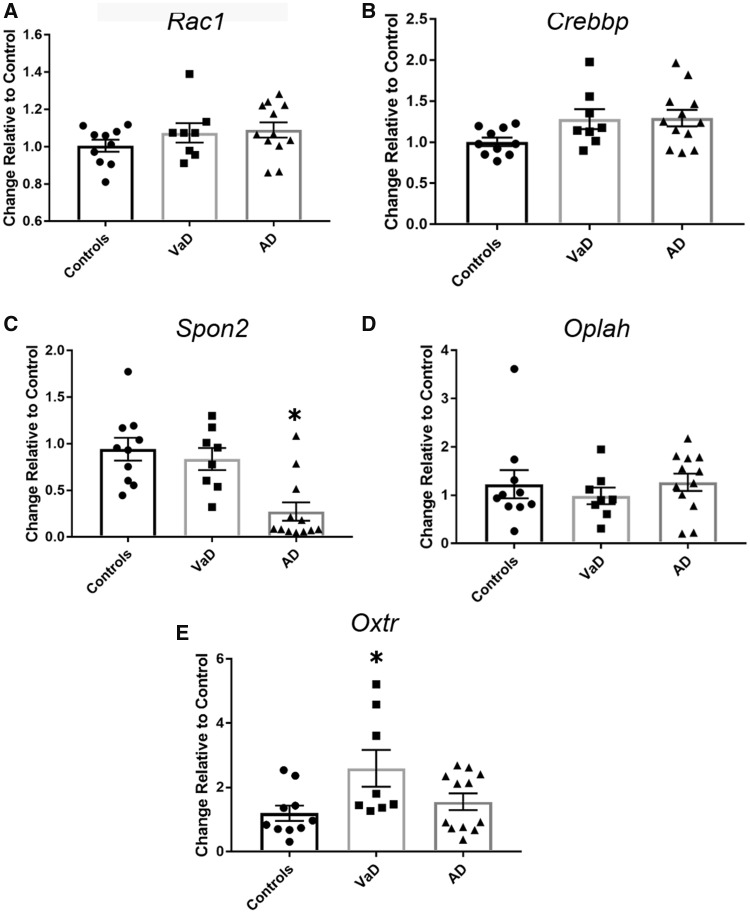
FIGURE 4.
qPCR validation of selected genes dysregulated via microarray analysis. (A) qPCR analysis of Crebbp mRNA in the same tissue blocks of frontal cortex examined by microarrays revealed a nonsignificant trend of upregulation in VaD and AD samples compared with control levels (one-way ANOVA [F = 2.99, p = 0.06]). (B)Rac1 levels did not differ between the 3 diagnostic groups (F = 1.22, p = 0.31). (C)Spon2 was significantly downregulated in AD compared with control samples (F = 11.18, p = 0.0003). (D)Oplah mRNA levels were unchanged among the 3 diagnostic groups (F = 0.4850, p = 0.6209). (E)Oxtr mRNA levels were significantly upregulated in the VaD samples (F = 3.886, p = 0.03). *p < 0.05.

