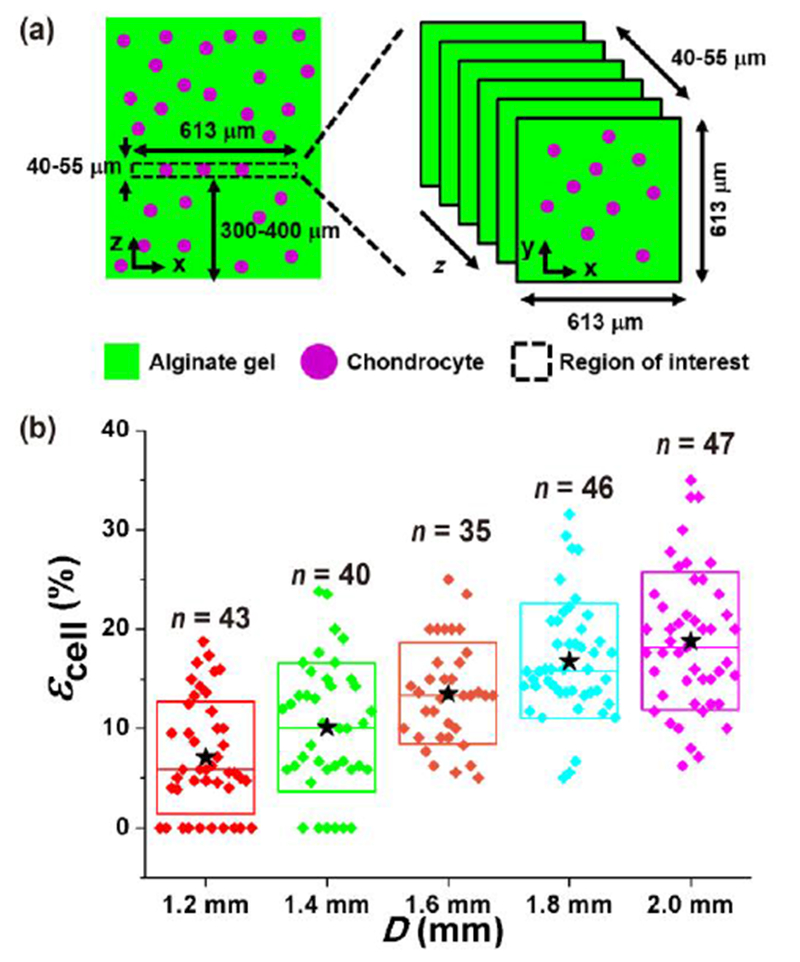
Fig. 5.

Chondrocyte deformation under static compression. (a) Imaged region in the alginate gel-chondrocytes construct was 613 μm × 613 μm × 40–55 μm (x × y × z) in size, and it was 300–400 μm from the gel base. (b) The compressive strain of chondrocyte (εcell) increased with the PDMS balloon diameter (D). The εcell values of chondrocytes were significantly different in all pairs (p < 0.05) except adjacent pairs (not significant, p > 0.05). n: the number of chondrocytes. ★: mean values. ◆: each data points. Top and bottom lines of the box: standard deviation. Middle line of the box: median value.
