
Fig. 6.
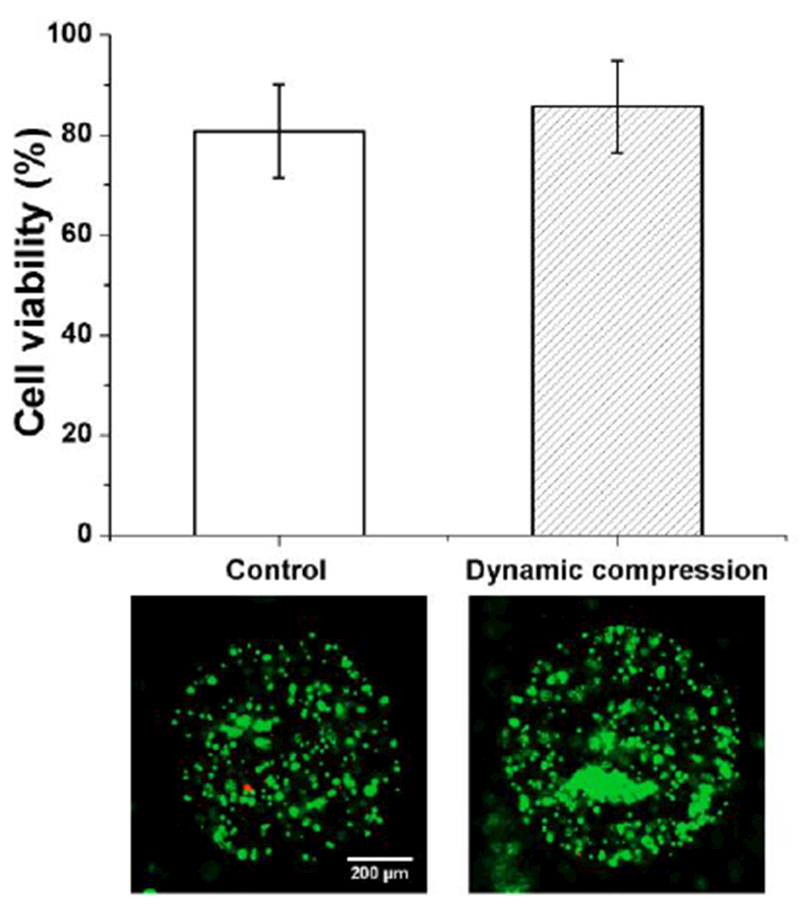
Chondrocyte viability without (control) and with 1 hour-long dynamic compression (1 Hz, 14 kPa air pressure, n = 3 devices). Error bar: standard deviation. Example images are shown below the plot. Green: live cells. Red: dead cells.
Official websites use .gov
A
.gov website belongs to an official
government organization in the United States.
Secure .gov websites use HTTPS
A lock (
) or https:// means you've safely
connected to the .gov website. Share sensitive
information only on official, secure websites.
Chondrocyte viability without (control) and with 1 hour-long dynamic compression (1 Hz, 14 kPa air pressure, n = 3 devices). Error bar: standard deviation. Example images are shown below the plot. Green: live cells. Red: dead cells.