
Figure 4. Physical characterization of tough cryogels.
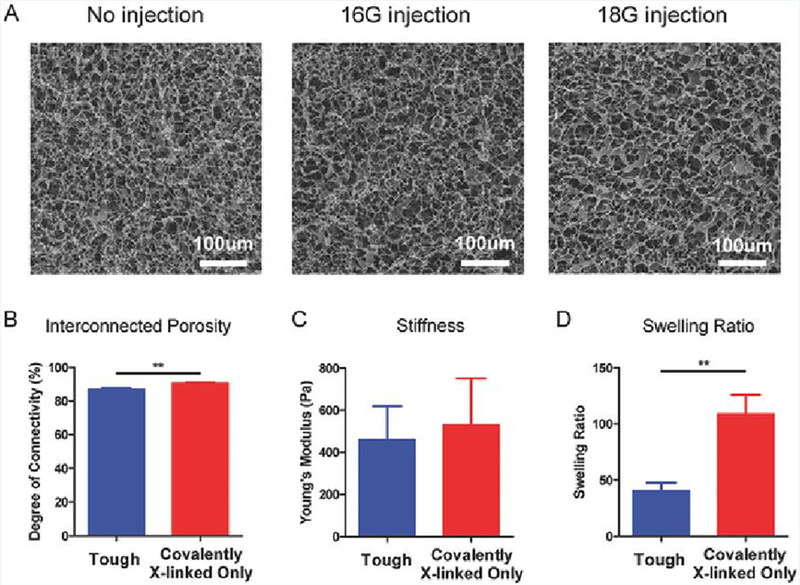
(A) Representative scanning electron microscopy images of tough cryogels without injection (left) and after 16G (middle) or 18G (right) needle injection. Interconnected porosity (B), stiffness (C), and swelling ratio (D) of tough and covalently crosslinked-only cryogels. n = 3. Values presented were expressed as mean ± s.d. Data were analyzed by a two-tailed Student’s t-test. ** p < 0.01