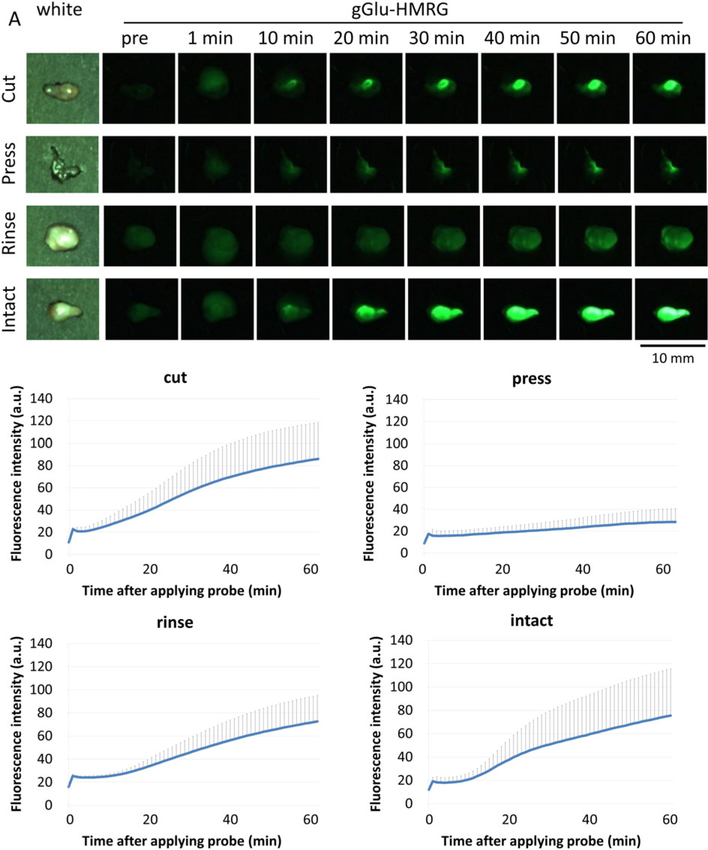
Figure 3.
gGlu-HMRG probe activation at OVCAR5 tumors. (A) Representative white light and fluorescence images of OVCAR5 tumors for each group (representative of four OVCAR5 tumors per group) before and 1, 10, 20, 30, 40, 50, and 60 min after gGlu-HMRG administration. (B) Changes in tumor fluorescence signals in OVCAR5 tumors (n = 4 per group). Data are mean fluorescence intensities (a.u.) ± SEM of tumors at different time points.

