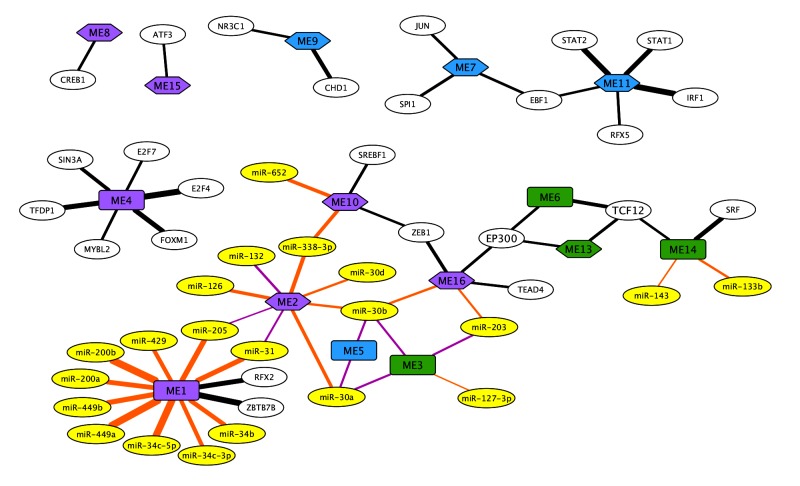
Figure 4.
Network of enriched transcription factors (white) and correlated miRNA (yellow) with each module. Modules upregulated in disease are shown as rectangles and modules downregulated in disease are shown as hexagons. Increased normalised enrichment scores are denoted by increased edge thickness. Biological function was categorised for immune response (blue) and fibrosis (green), with remaining modules labelled purple. The transcription factor EP300 (red lines) and TCF12 (orange lines) were highlighted as forming a network linking the fibrosis and immune response associated modules.

