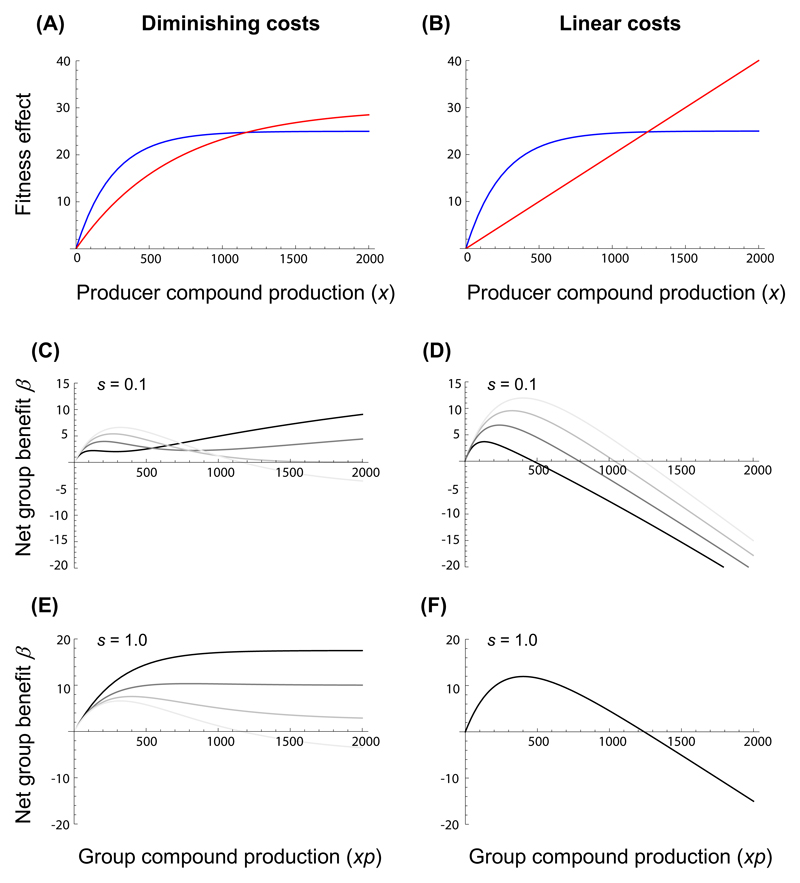
Figure 1. The net benefit to a group of bacteria producing a shared compound in relation to absolute compound production costs, shareability and the proportion of producers within the group.
Panels A and B show examples of a diminishing and a linear absolute compound cost function C (red lines), respectively, in relation to a saturating gross benefit function B for producers (blue lines) assuming shareability s = 0. Panels C - F depict the resulting net benefit β = B - C to the group as a function of group compound production (xp), for different values of compound shareability s and degrees of production specialization p (grey shaded lines) among cells within the group: (C) diminishing costs and low shareability; (D) linear costs and low shareability; (E) diminishing costs and high shareability; (F) linear costs and high shareability. Grey shaded lines indicate scenarios for different proportions of producers, ranging from p = 1 (faint grey line), to p = 0.75 (light intermediate grey line), to p = 0.5 (dark intermediate grey line), to p = 0.25 (dark grey line). Note that maximum net group benefits equal single-cell optima for p = 1.

