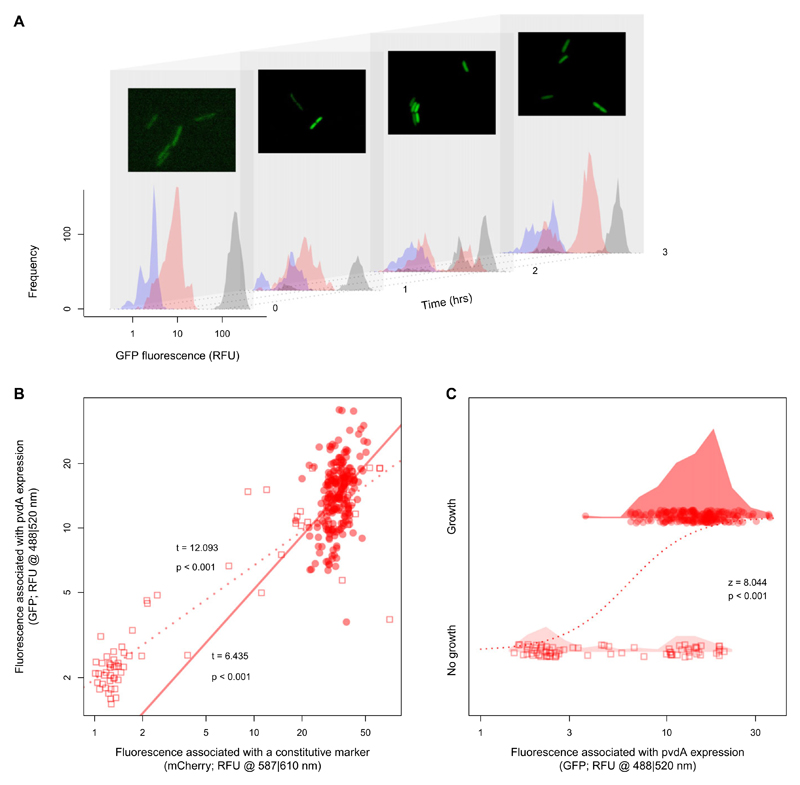
Figure 4. Microscopy confirms unimodal pvdA expression among growing cells.
(A) Histograms show distributions of individual-level GFP expression of the pvdA-gfp reporter (red), the constitutive gfp reporter (grey), and the wildtype strain without gfp reporter (blue) over time. Microscopy pictures show representative snapshots of the PAO1pvdA-gfp strain (brightness and contrast were adjusted manually). Data reveal a significant increase in bimodality in pyoverdine expression over time (linear increase of Hartigan’s Dn, diptest for bimodality (Maechler and Ringach 2013), for the pvdA-gfp reporter: t66 = 2.85, p = 0.006, but neither for the constitutive gfp reporter control: t66 = 1.16, p = 0.249, nor for the wildtype strain without gfp: t66 = -0.94, p = 0.352). However, (B) fluorescence from expression of a constitutive mcherry control marker served as a significant linear predictor of fluorescence from expression of pyoverdine (pvdA-gfp) both for growing (filled circles) and non-growing cells (empty squares). This suggests that pyoverdine expression levels are linked to the overall cellular gene expression activity. (C) Bimodality in pvdA-gfp expression is only observed among non-growing cells (squares), but was absent among dividing cells (circles; ≥ 2 divisions observed within four hours) (Dn = 0.024, p = 0.485). This indicates that bimodality in pyoverdine expression at the whole population level is mainly driven by bistability in the growth status of cells (dashed line: significant logistic regression between a cell’s pyoverdine (pvdA-gfp) expression and its growth status). Shaded areas show density functions of pvdA-gfp expression levels.

