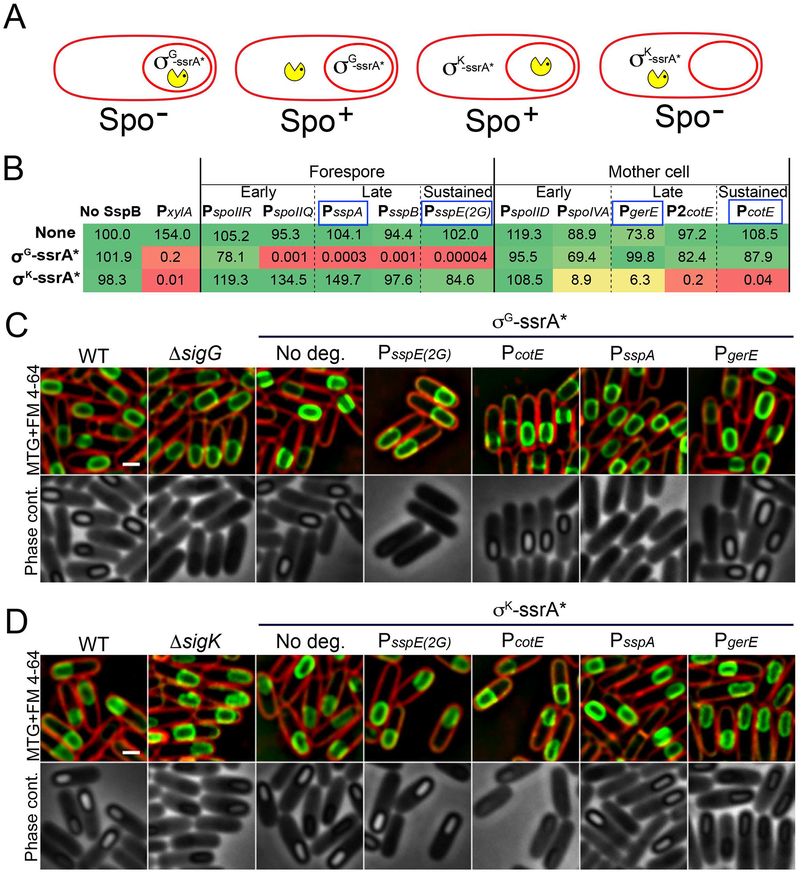
Figure 3. Optimization of cell- and stage-specific protein degradation system.
A. Diagram representing the genetic strategy used to screen for cell-specific promoters that trigger the efficient degradation of target proteins when driving the expression of sspBEc. We constructed ssrA*-tagged versions of the σG and σK, which are essential for sporulation and required in the forespore and mother cell, respectively. Degradation of either protein in the cell in which they are required should yield a strong sporulation defect (Spo−), while expression of sspBEc in the opposite cell should have no effect (Spo+).
B. Relative spore titers of strains expressing sspBEc from different cell-specific promoters (columns) in the absence of ssrA*-tagged protein (none), when σG is tagged with ssrA* (σG-ssrA*) or when σK is tagged with ssrA* (σK-ssrA*). To facilitate data comparison, the spore titer of the wild type strain (no ssrA*, no SspBEc) was relativized to 100. The actual values are shown in Table S1. The color indicates the severity of the spore titer defect (green, no defect; yellow, moderate defect; red, severe defect). Expression from PxylA was induced by the addition of 1 % xylose. Sporulation-specific promoters promoters were classified in three temporal classes according to their expression pattern: early promoters are activated shortly after polar septation, and inactivated after engulfment; late promoters activated after engulfment; sustained promoters are continuously active throughout engulfment and forespore maturation. The promoters selected for further characterization are indicated by a blue box.
C. Micrographs of wild type sporangia (WT), σG mutant sporangia (ΔsigG) and sporangia in which σG is tagged with ssrA* (σG-ssrA*) in the absence of SspBEc (No deg.) or when SspBEc is produced from the sustained promoters PsspE(2G) and PcotE or the late promoters PsspA and PgerE. The top row shows membranes stained with FM 4–64 (red) and Mitotracker green (green). The bottom row shows phase contrast pictures. Pictures were taken six hours after sporulation induction (t6). Scale bar, 1 μm.
D. Micrographs of wild type sporangia (WT), σK mutant sporangia (ΔsigK) and sporangia in which σK is tagged with ssrA* (σK-ssrA*) in the absence of SspBEc (No deg.) or when SspBEc is produced from the sustained promoters PsspE(2G) and PcotE or the late promoters PsspA and PgerE. The top row shows membranes stained with FM 4–64 (red) and Mitotracker green (green). The bottom row shows phase contrast pictures. Pictures were taken six hours after sporulation induction (t6). Scale bar, 1 μm.

