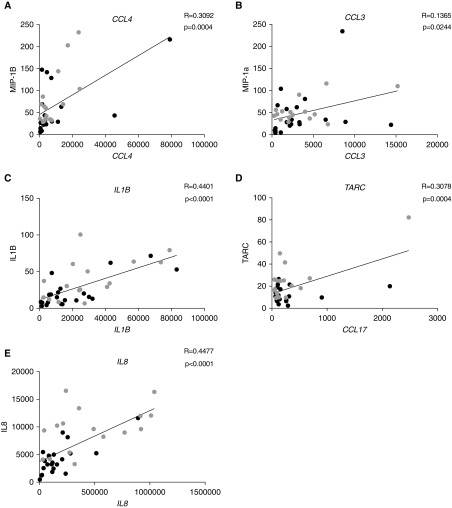
Figure 6.
Gene and protein data correlation. Correlation of associated gene and protein data is shown, demonstrating that functional protein data correlates with gene expression data. Representative data for proteins (y-axis) with matching gene expression data (x-axis) are shown. (A) CCL4, (B) CCL3, (C) IL1B, (D) TARC, and (E) IL8.

