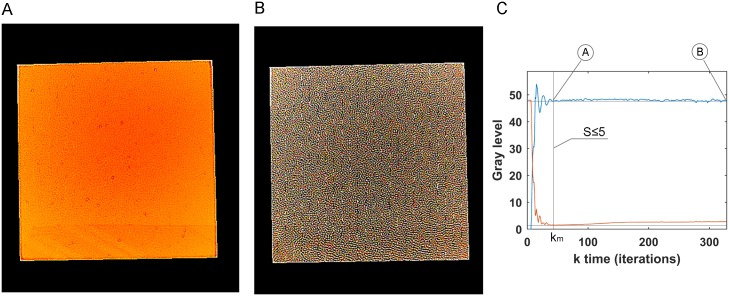
Fig 5. Stop control.
(A) and (B) are the light patterns used as the control signal at different k instants when the error came close to zero, but (A) is the first one to reach it, and (B) is 283 iterations later. (C) Shows the output (blue) which is the grey level mean of image and control error to get reference.

