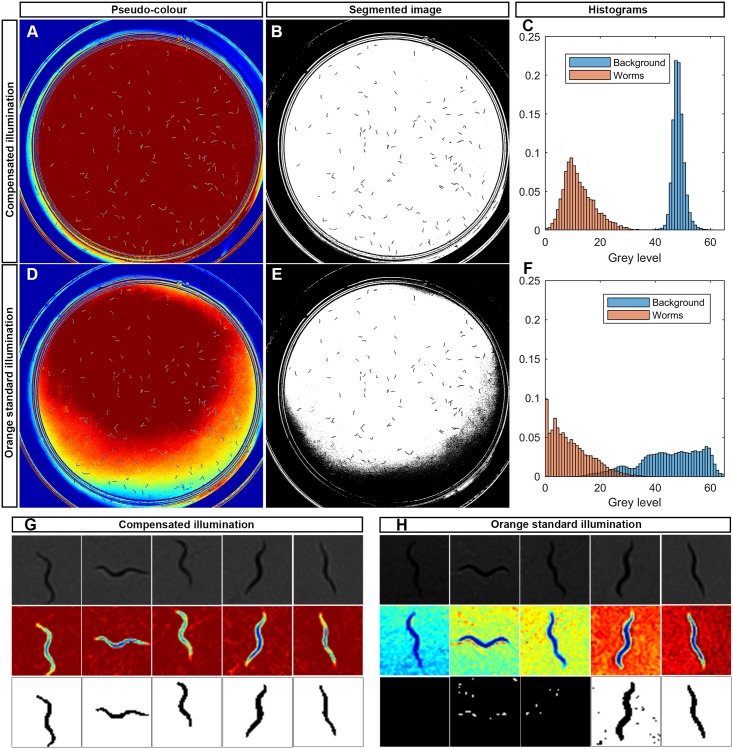
Fig 7. Spatial variability under orange light.
A: Captured image pseudo-colour with compensated illumination. B: Segmented image of (A) by a threshold method. C: Histogram of grey level of background (blue) and worms (red) from (A). D: Captured image pseudo-colour with orange standard illumination. E: Segmented image of (D) by a threshold method. F: Histogram of grey level of background (blue) and worms (red) from (D). G: Worm image examples from (A) in pseudo-colour, grey scale and segmented. H: Worm image examples from (D) in grey scale, pseudo-colour and segmented.

