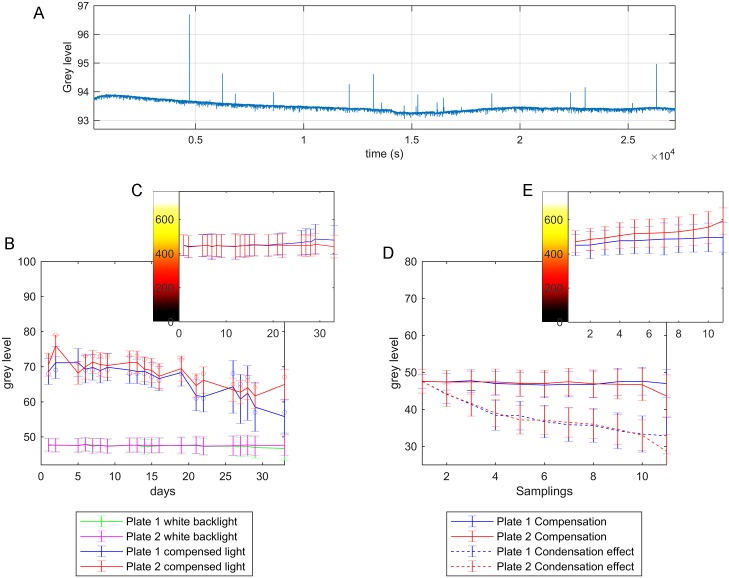
Fig 8. Temporal variability graphics.
A: The average grey level of the image produced by a white backlight with time (about 30,000s). B: The mean grey levels and deviations of two plates for the white backlight and for the compensated light. C: The mean control signals and deviations applied for compensating images: (B) every day. D: The mean grey levels and deviations of two plates with condensation slowly increasing for the new backlight compensation every time that the mean image grey level error dropped below -3, and for the compensated light at the beginning (this lasted approximately 2h). E: The mean control signals and deviations applied for compensating the images in (D) during each new compensation event.

