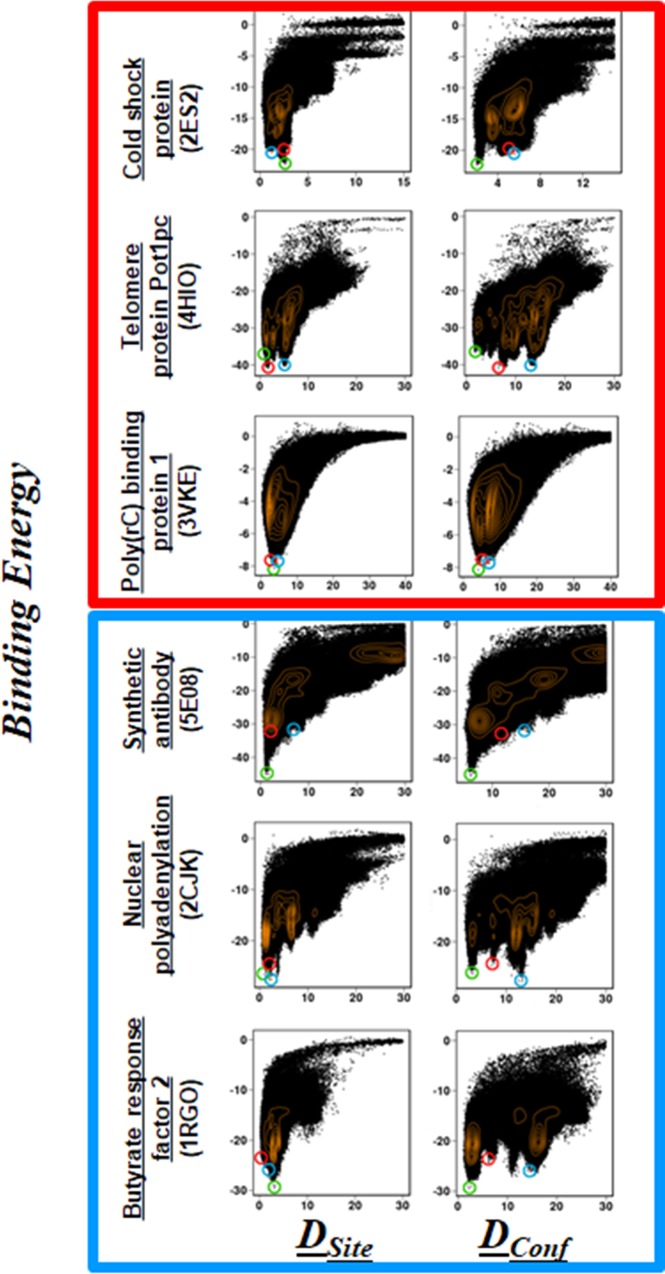
Fig 5. Energy landscapes for simulated ssDNA–ssDBP and ssRNA–ssRBP complexes.
The binding energy (Kcal mol-1) is plotted versus DSite and DConf for each of the ssDBP–ssDNA (top, red square) and ssRBP–ssRNA (bottom, blue square) complexes. The points encircled in green, red, and blue correspond to the respective ssDNA/ssRNA conformations shown in Fig 4. The population density of the ssDNA/ssRNA ensemble is shown by orange contour lines. A funnel-shaped binding energy landscape is present in all cases, with ssDNA/ssRNA conformations closest to the experimental structures possessing the minimal energy.

