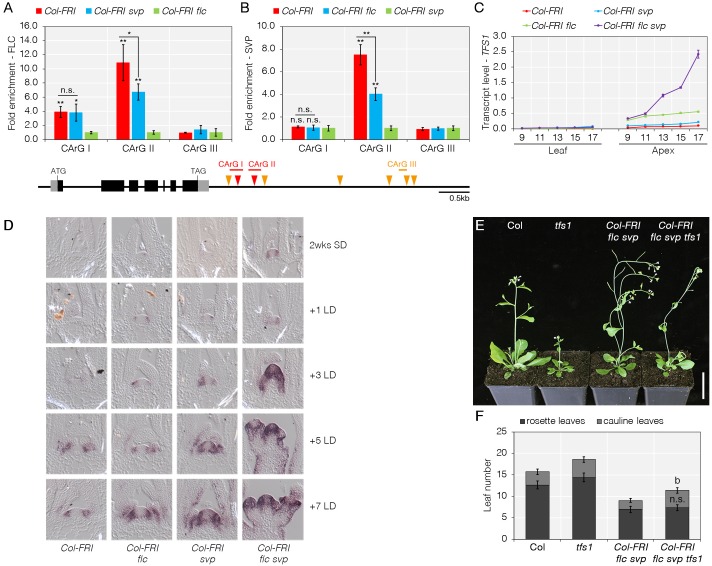
Fig 1. TFS1 is directly regulated by FLC and SVP during floral induction.
A and B) Analysis of FLC (A) and SVP (B) binding to TFS1 by ChIP-qPCR. Grey and black boxes depict UTR and exons, respectively. Orange and red triangles indicate CArG-boxes with CCW(6)GG and CCW(6)RG consensus, respectively. Plant material used and replicates performed are described in Methods. Values were scaled to set value of CArG-box I in Col-FRI flc svp to 1. Statistical significance was calculated using Student’s t-test against Col-FRI flc (A) and Col-FRI svp (B). Also for CArG II the significance of the difference in enrichment between Col-FRI and Col-FRI svp was tested. *P < 0.05, **P < 0.01, n.s. P > 0.05. C) Increased expression of TFS1 in apices of Col-FRI flc svp plants by RT-qPCR. Numbers on X-axis indicate number of long-days (LD) for which plants were grown prior to RNA extraction. D) Spatial pattern of expression of TFS1 assessed by in situ hybridization during floral transition. E and F) Representative photo of plants of the illustrated genotypes 28 days after germination under LDs (E) and their respective flowering time (F). Statistical significance was calculated using Student’s t-test; P < 0.01.

