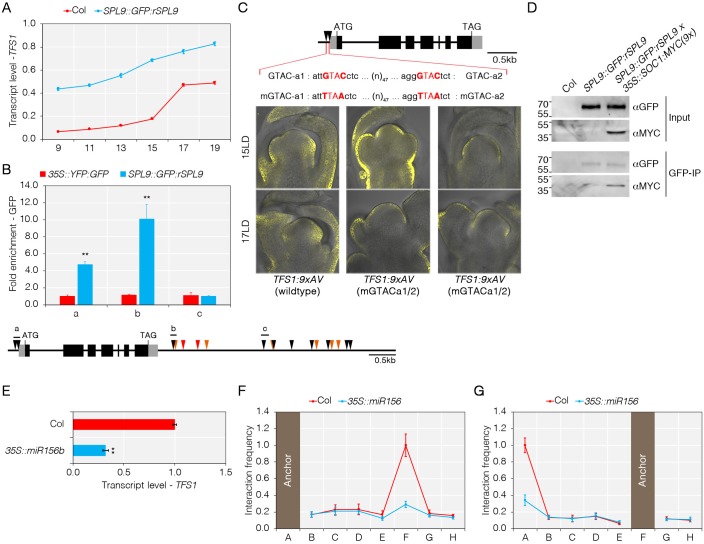
Fig 6. Cooperativity between SPL9 and SOC1 in the activation of TFS1.
A) Increased expression of TFS1 is enhanced by rSPL9. Numbers on X-axis indicate number of long-days (LD) for which plants were grown prior to harvest. B) Top: SPL9 binds to the 5’ and 3’ end of TFS1. Bottom: Cartoon of potential SPL9 binding sites and amplicons used for ChIP-PCR. Binding sites for SPL9 are depicted in black and CArG-boxes in red and orange triangles. Values were scaled to set value of amplicon a in 35S::YFP:GFP to 1. Statistical significance was calculated using Student’s t-test; **P < 0.01. C) Top: Model of TFS1 genomic region and the mutations introduced into SPL-binding sites. Bottom: Mutation of two putative SPL binding sites reduces TFS1 expression during floral transition. D) SOC1 co-immunoprecipitates with SPL9. Values on the left of the Western-blots indicated molecular weight (kDa). E) Overexpression of miR156b reduces TFS1 mRNA levels. Statistical significance was calculated using Student’s t-test; **P < 0.01. F and G) Overexpression of miR156b reduces loop formation between 5’ and 3’ end of TFS1.

