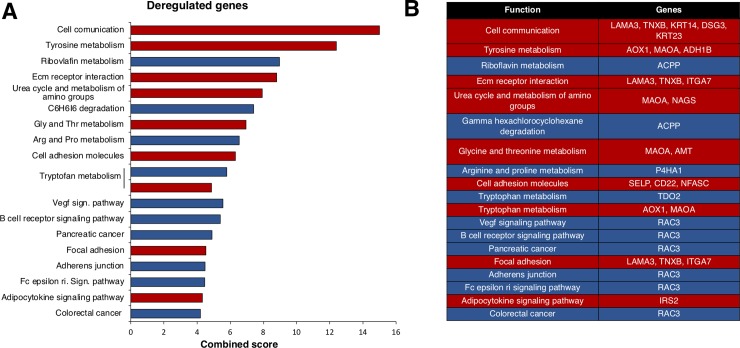
Fig 4. Functional analysis of deregulated genes included in the KMT2D mutated signature.
A. Percentage of deregulated genes included in the KMT2D mutated signature by biological function. Overexpressed genes are displayed in blue and down-expressed genes in red. For functional annotation analysis, the online tool Enrichr was used as described in material and methods. B. Deregulated genes included in each function.

