
Fig 6. Correlation analysis of relative expression levels determined by RNA-seq and qPCR on selected genes NADP-ME (MDP0000568928), NAD-MDH (MDP0000174740), PEPCK (MDP0000661864) and PEPC (MDP0000073810).
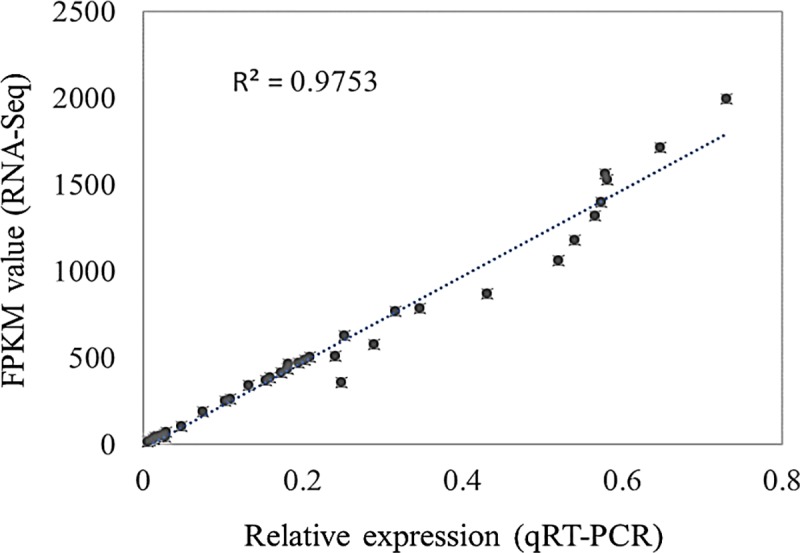
All qPCR reactions were carried out by using three independent biological replication and repeated three times. Relative expression levels were calculated from CT values according to the 2-ΔΔCT method. Actin was used as the reference gene for these qPCR experiments.